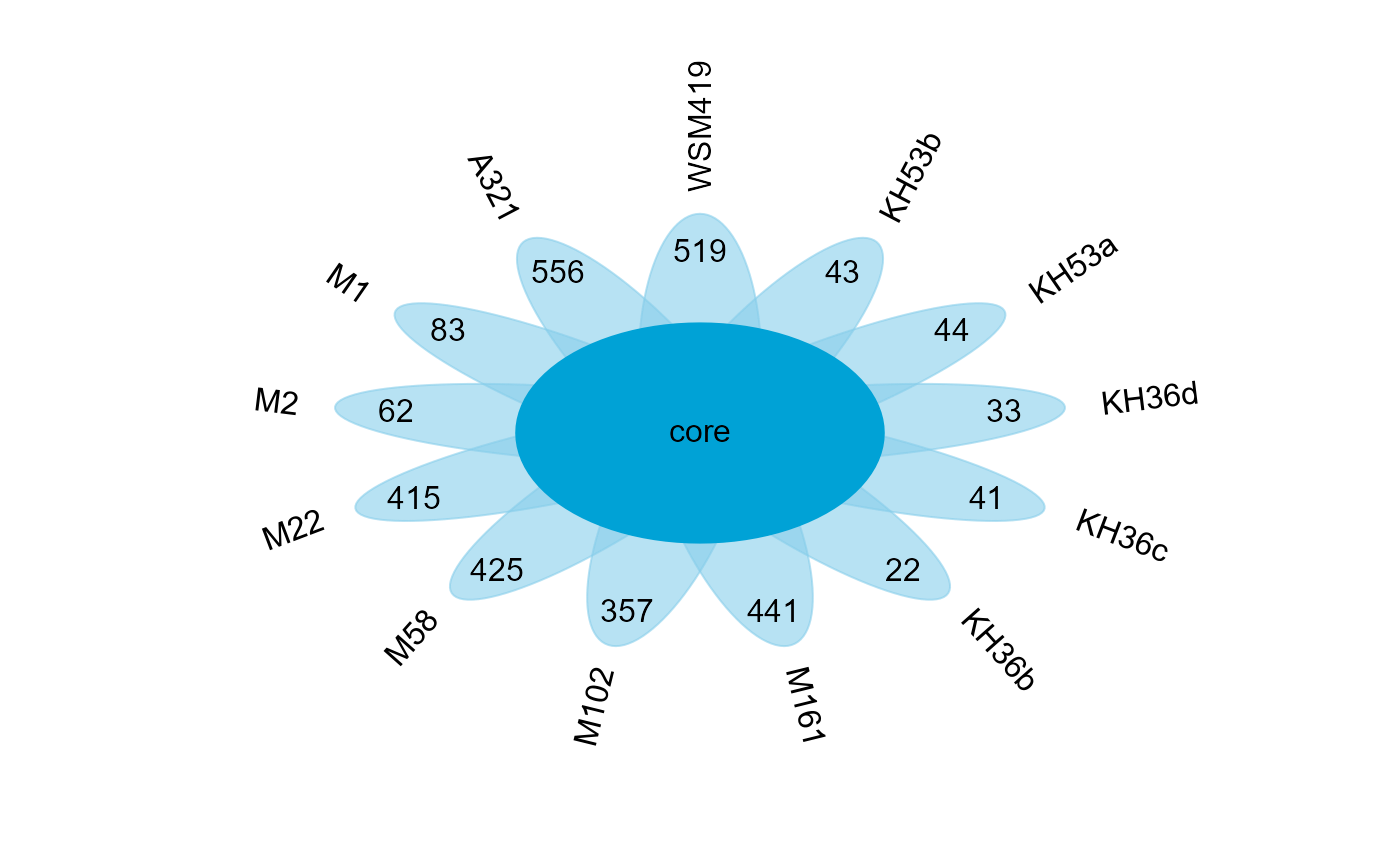
Draw flower plot.
Arguments
- sample
A vector contains the name of each petal
- value
A vector contains the value of each petal
- labels
The label of the core
- start
Start deg, default is 90
- a
Width of the petal, default is 0.5
- b
Length of the petal, default is 2
- r
Radius of the core, default is 1.5
- width
Width of the plot, default is 10
- height
Heigth of the plot, default is 10
- ellipse_col
Color of the petal
- circle_col
Color of the core
- circle_text_cex
Text size of label around the petal, default is 1
Value
Flower plot
