Chapter 14 Building regulatory network
TOBIAS has been able to build the regulatory network of TF from the identified footprints. This is somewhat flawed due to the fact that it annotates peaks to the nearest gene. Here, we got reliable peak-gene linkages in the previous chapter. We can construct more stable regulatory networks. Simply put, if there is a TF A footprint in an open region that happens to be associated with the expression of gene B, then we consider that TF A regulates gene B.
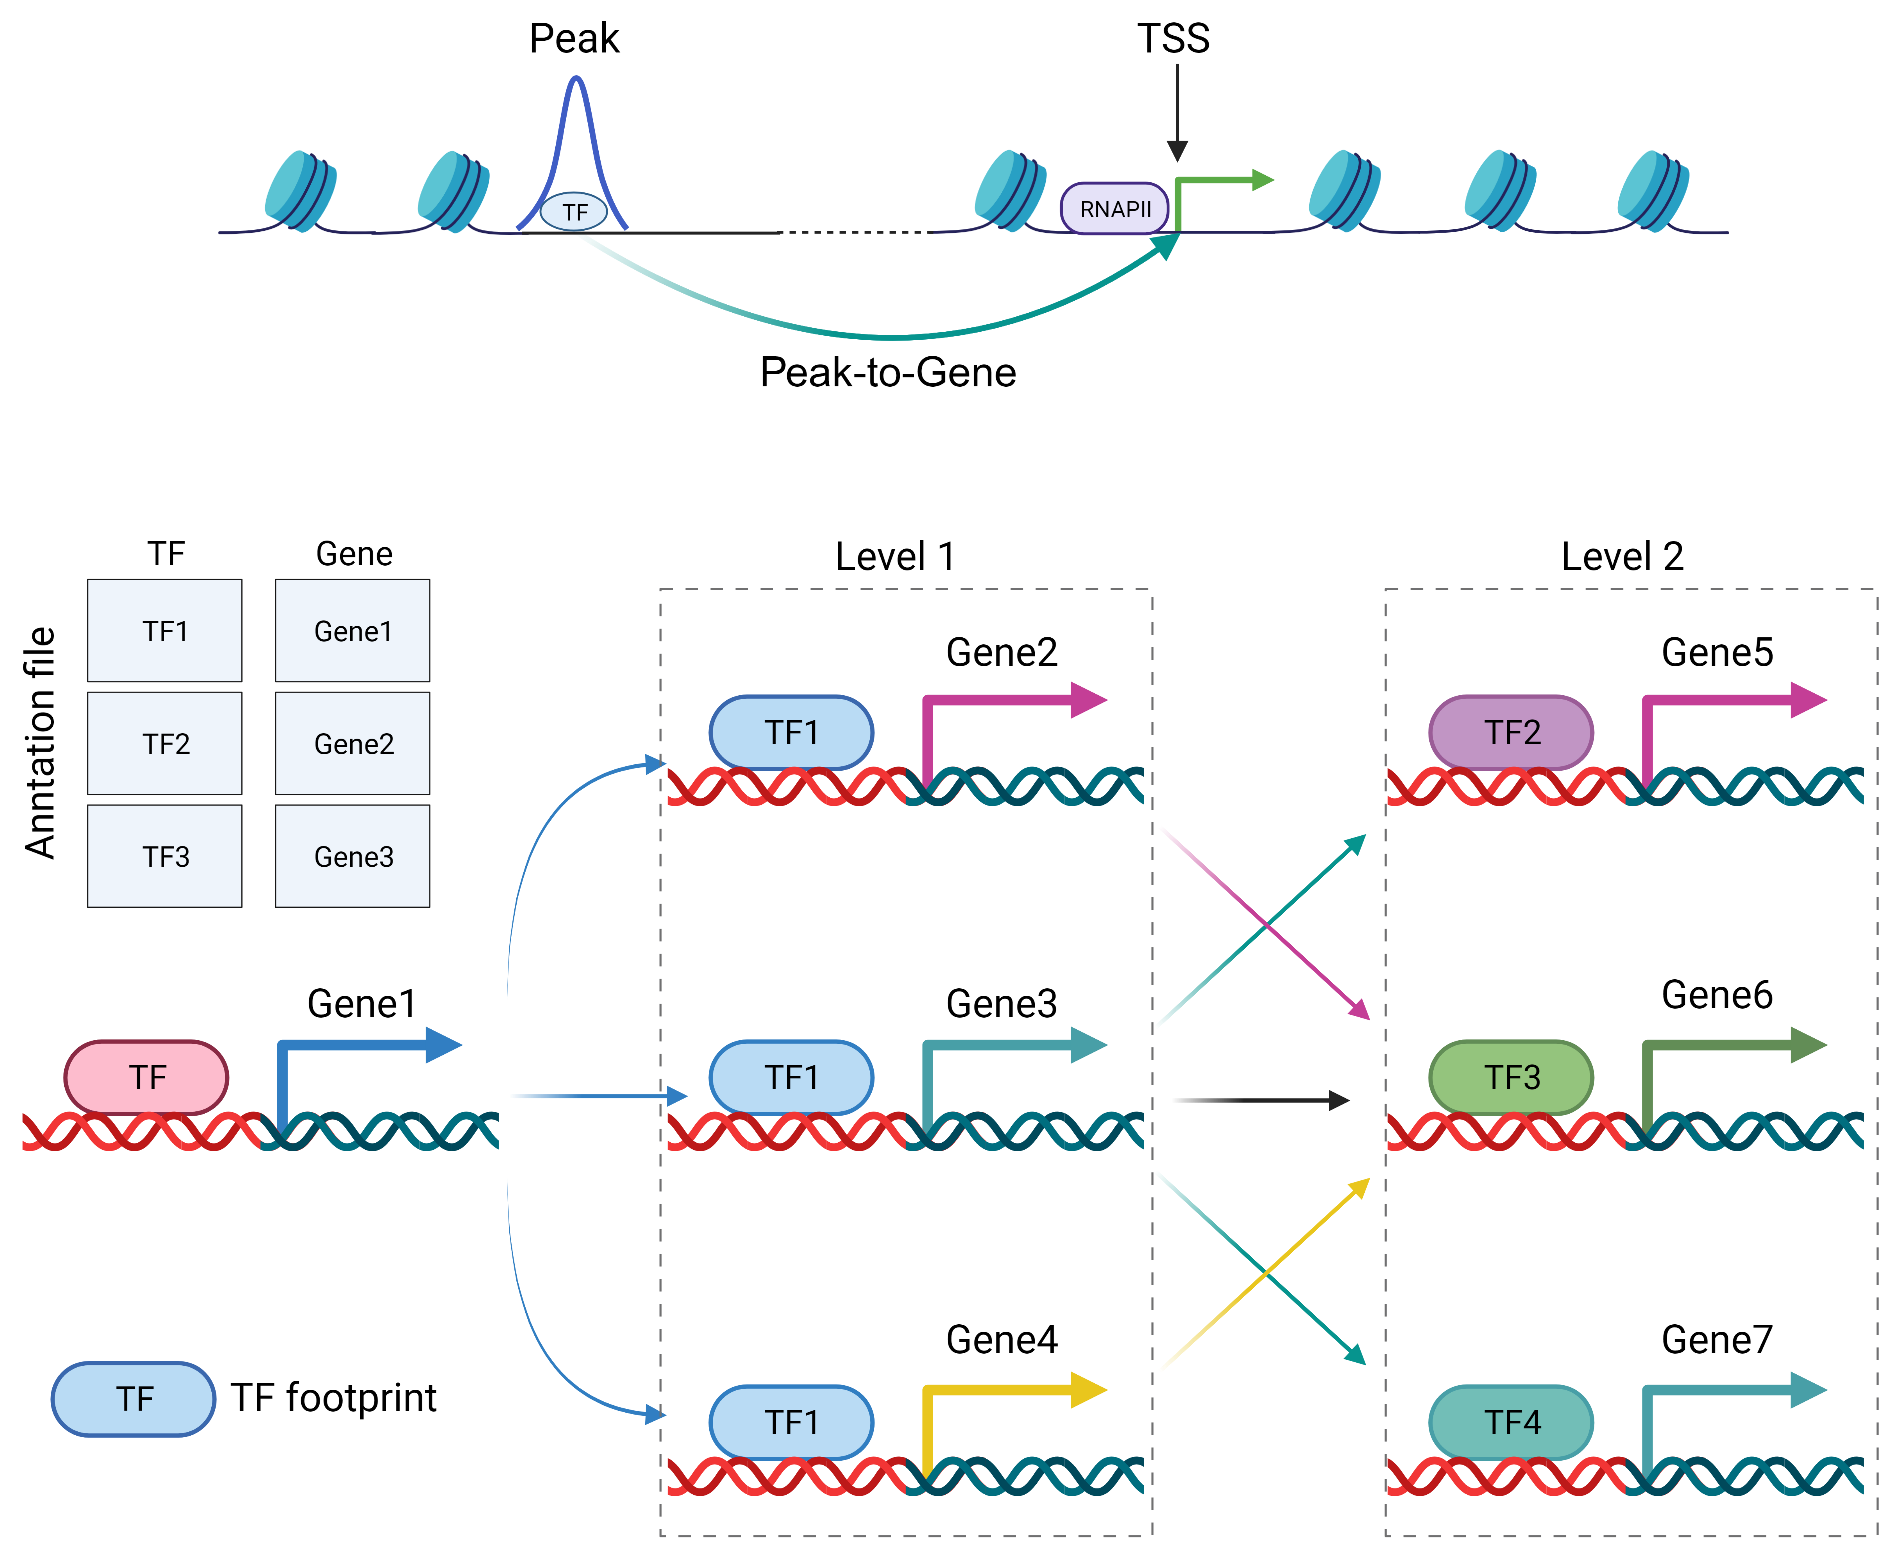
14.1 Motif2Gene
We first need to prepare the necessary annotation files. One is a PWM file containing TF motifs. The other is the family annotation information corresponding to each TF. The following is an example of a TF family annotation file:
##    Symbol         Ensembl   Family
## 1  ZBTB8B ENSG00000273274     ZBTB
## 2    GSX2 ENSG00000180613 Homeobox
## 3    TBX2 ENSG00000121068    T-box
## 4    PAX8 ENSG00000125618      PAX
## 5 CREB3L1 ENSG00000157613  TF_bZIP
## 6 NKX6-1 ENSG00000163623 Homeoboxlibrary(org.Hs.eg.db)
motif2gene <- getMotif2Gene(motif_file = "F:/cisDynet/example/jaspar.moitf.txt", orgdb = org.Hs.eg.db, tf_family = "F:/cisDynet/example/tf_family.txt")
head(motif2gene)## ENSEMBL Motif_ID Motif_Name Gene_Name Family
## 1 ENSG00000001167 MA0060.3 NFYA NFYA NF-YA
## 2 ENSG00000005102 MA0661.1 MEOX1 MEOX1 Homeobox
## 3 ENSG00000005513 MA0868.2 SOX8 SOX8 HMG
## 4 ENSG00000006194 MA0528.2 ZNF263 ZNF263 zf-C2H2
## 5 ENSG00000006377 MA0882.1 DLX6 DLX6 Homeobox
## 6 ENSG00000006468 MA0761.2 ETV1 ETV1 ETS14.2 Building regulatory network
net <- getNetwork(sample = "Bulk_B",
                  tf = "TFEB_MA0692.1",
                  peak2gene = "F:/cisDynet/example/Peak2Gene_All_Links.rds",
                  p2g_cutoff = 0.6,
                  motif2gene = motif2gene,
                  targets = 1,
                  level = 2)
head(net)
## Source Target P2G_Correlation Motif_ID Level
## 1 TFEB TBX21 0.6410822 TBX21_MA0690.2 1
## 2 TFEB ZNF416 0.6401947 ZNF416_MA1979.1 1
## 3 TFEB MYBL2 0.8903174 MYBL2_MA0777.1 1
## 4 TFEB DBP 0.6732853 DBP_MA0639.1 1
## 5 TFEB BHLHE41 0.7490192 BHLHE41_MA0636.1 1
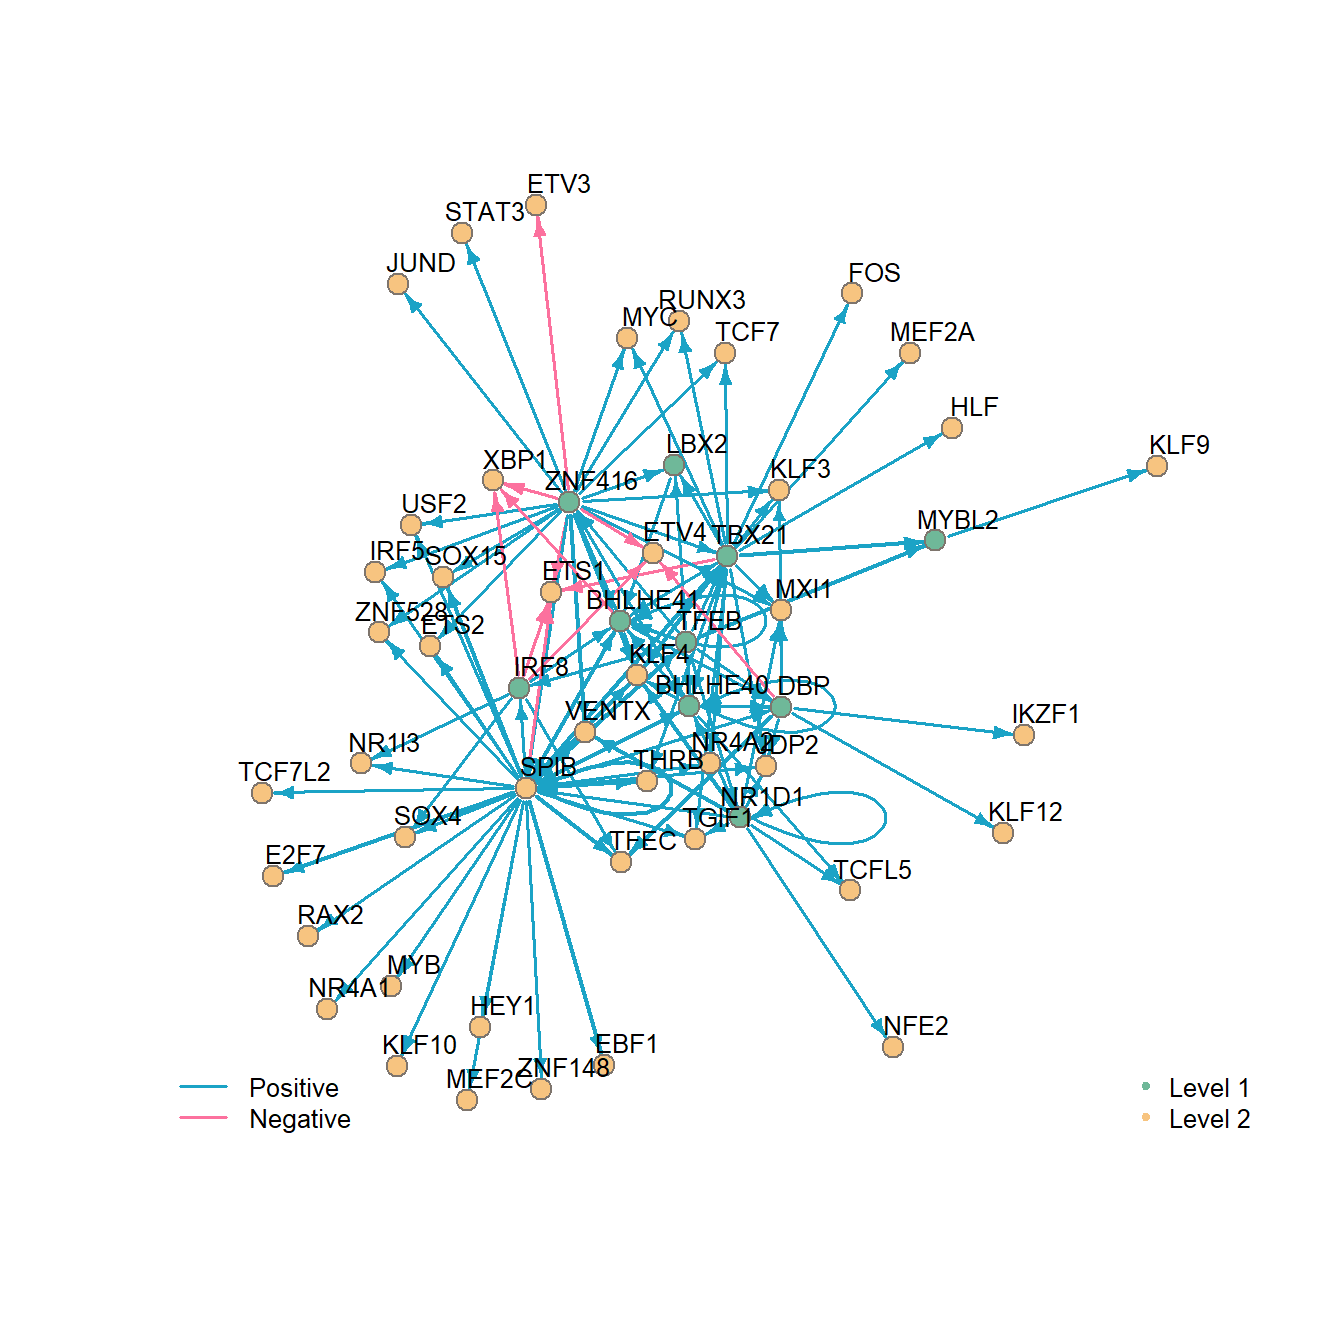
## 6 TFEB NR1D1 0.6404045 NR1D1_MA1531.1 1We can visualize this network with the plotNetwork function.
plotNetwork(network = net)