Chapter 11 Footprint Analysis
When a TF is bound to a DNA region, the transposase is unable to insert adapters at that location, creating a “footprint” in the sequencing data. This footprint appears as a region where the ATAC-seq reads are reduced or absent compared to the surrounding chromatin.
Nowadays, there are already many tools for identifying footprints, such as HINT-ATAC, TOBIAS, Wellington and so on. Here we use TOBIAS to analyze the footprint.
When we do footprint analysis, we need to add the necessary file paths first with addFootprint.
addFootprint(corrected_signal = "F:/cisDynet/example/ATACcorrect/",bindetect_result = "F:/cisDynet/example/BINDetect/")11.1 Get footprint score
We can get the activity of each TF in each sample by getFootprintScore.
ftScore <- getFootprintScore()
head(ftScore)
## output_prefix Bulk_B CD8pos_T Central_memory_CD8pos_T
## 1 Arnt_MA0004.1 0.57220 0.57560 0.53371
## 2 AhrArnt_MA0006.1 0.55047 0.55900 0.52595
## 3 Ddit3Cebpa_MA0019.1 0.27880 0.27388 0.26135
## 4 Mecom_MA0029.1 0.18764 0.19913 0.19897
## 5 FOXF2_MA0030.1 0.22045 0.23356 0.22986
## 6 FOXD1_MA0031.1 0.22419 0.24244 0.23578
## Effector_CD4pos_T Effector_memory_CD8pos_T Follicular_T_Helper Gamma_delta_T
## 1 0.57249 0.54929 0.56040 0.50959
## 2 0.56402 0.53134 0.55259 0.49953
## 3 0.25701 0.27321 0.27869 0.24428
## 4 0.18634 0.20657 0.20197 0.17834
## 5 0.21966 0.24062 0.23887 0.20695
## 6 0.22659 0.24658 0.24859 0.20993
## Immature_NK Mature_NK Mem_B Memory_Teffs Memory_Tregs Monocytes Naive_B
## 1 0.51436 0.56104 0.56374 0.52231 0.51496 0.58107 0.56645
## 2 0.49235 0.52990 0.53876 0.51951 0.49828 0.54544 0.53619
## 3 0.24540 0.26540 0.28018 0.22820 0.25163 0.33251 0.26496
## 4 0.17999 0.18981 0.18788 0.16242 0.18863 0.17802 0.18235
## 5 0.20160 0.21726 0.22333 0.19252 0.22295 0.20437 0.21663
## 6 0.20290 0.22179 0.22742 0.19777 0.22851 0.20863 0.22038
## Naive_CD8_T Naive_Teffs pDCs Plasmablasts Regulatory_T Th1_precursors
## 1 0.56634 0.56474 0.48592 0.55754 0.51623 0.55022
## 2 0.56175 0.55150 0.46297 0.54157 0.50802 0.54467
## 3 0.29591 0.24658 0.29228 0.27541 0.26275 0.24858
## 4 0.20266 0.16727 0.20202 0.17425 0.19060 0.17656
## 5 0.24787 0.20273 0.22289 0.20567 0.23376 0.20972
## 6 0.26254 0.21163 0.23235 0.20926 0.24104 0.2154811.2 Plot footprint score
We can visualize the distribution of TF footprint scores in all samples as a way to find differences in TF activity between samples.
labels <- sample(ftScore$output_prefix, 20)
plotFootprintScore(score_result = ftScore, cluster_N = 6,label_motif = labels)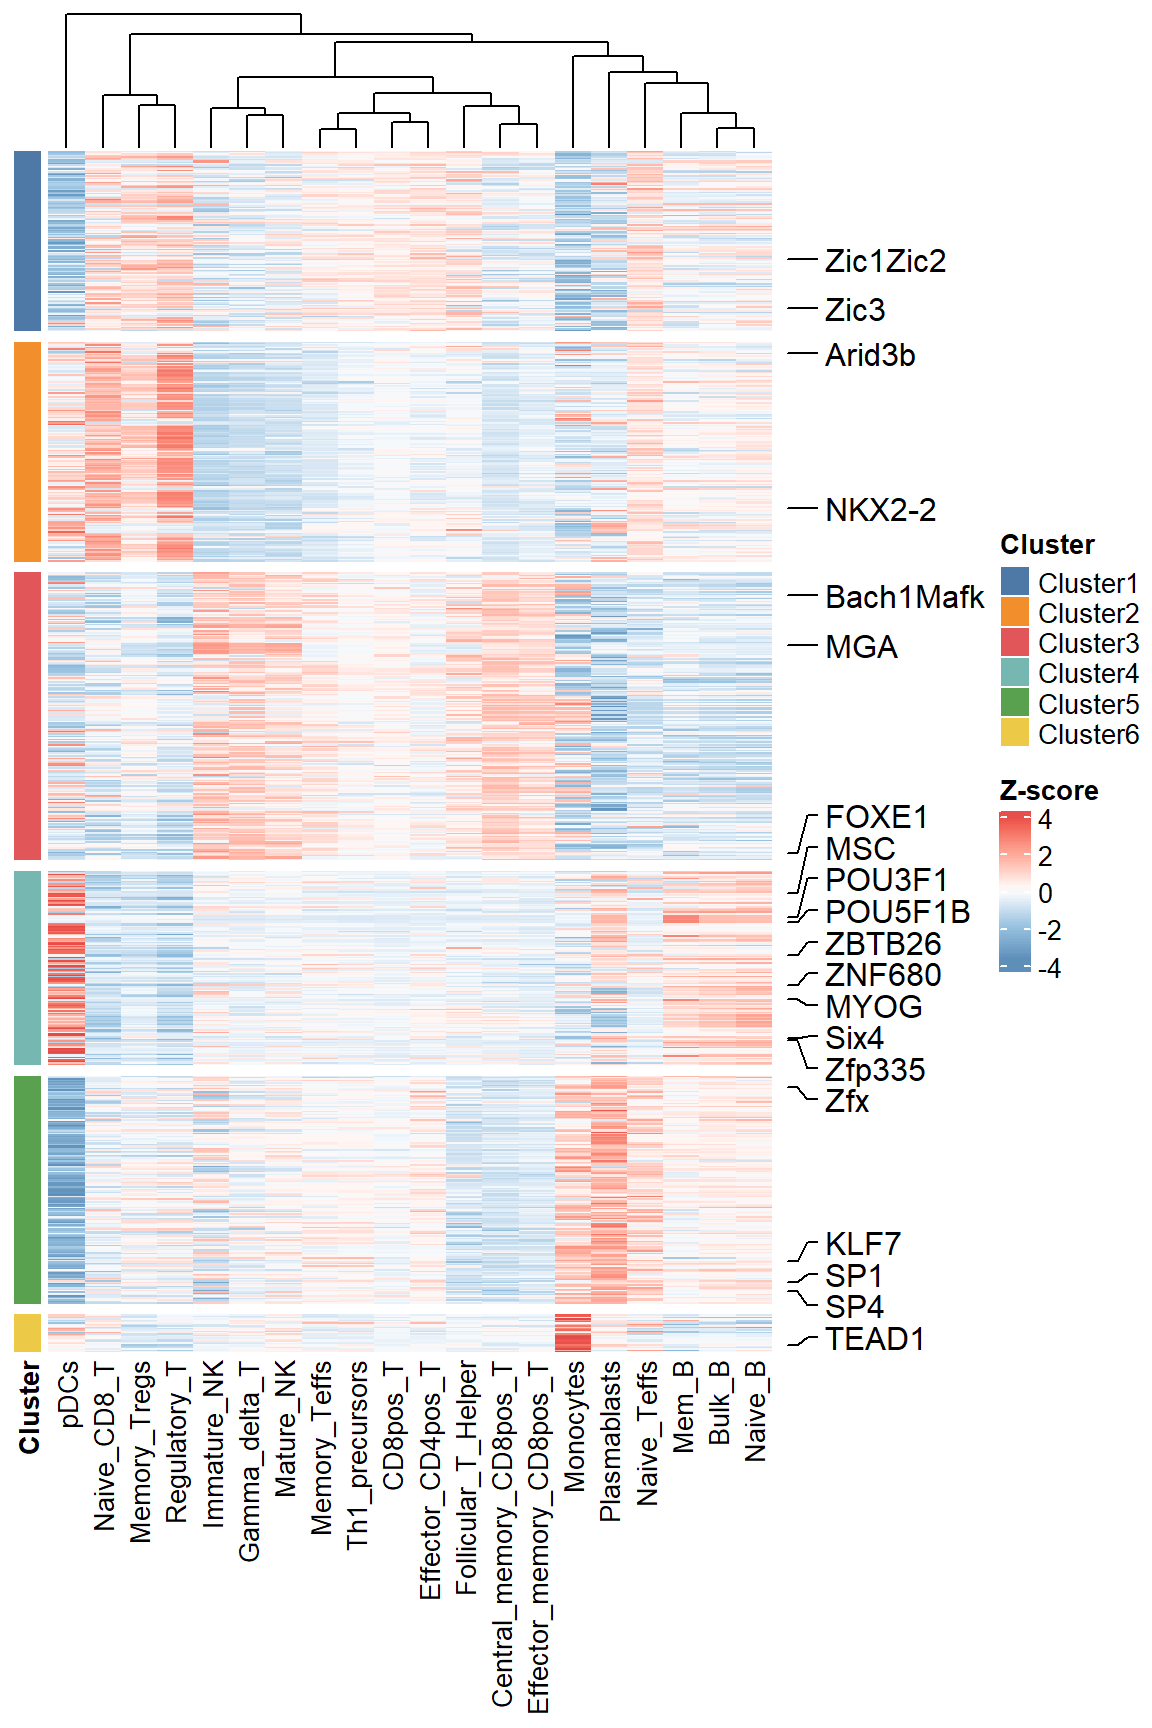
11.3 Compare Footprints
You can use compareFootprints to compare the differences in certain samples by comparing the distribution of Tn5 cuts around the binding site on the whole genome for a given TF.
compareFootprints(samples = c("Bulk_B","pDCs"),motif = "ATF2_MA1632.1",N_cores = 1)## 2023-10-23 15:37:53 Reading footprint...## 2023-10-23 15:37:53 Reading bigwig...## 2023-10-23 15:38:39 Normalize to matrix...## Warning: Smoothing are failed for 287 rows because there are very few signals
## overlapped to them. Please use `failed_rows(mat)` to get the index of
## failed rows and consider to remove them.## No id variables; using all as measure variables## 2023-10-23 15:39:44 Reading footprint...## 2023-10-23 15:39:44 Reading bigwig...## 2023-10-23 15:40:24 Normalize to matrix...## Warning: Smoothing are failed for 1303 rows because there are very few signals
## overlapped to them. Please use `failed_rows(mat)` to get the index of
## failed rows and consider to remove them.## No id variables; using all as measure variables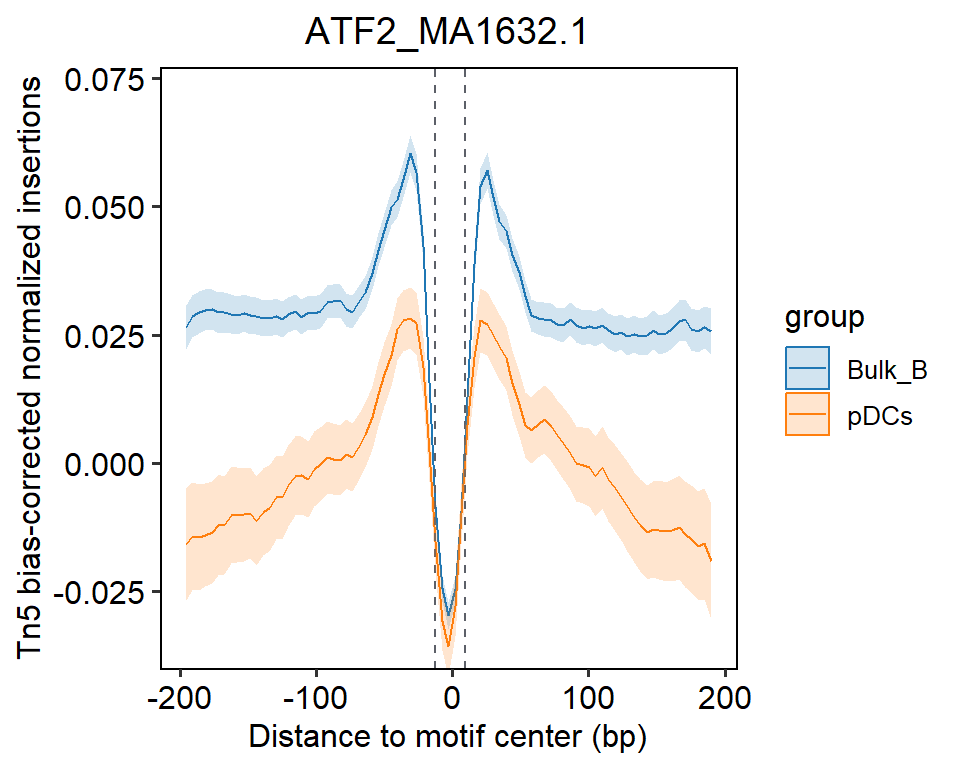
11.4 Get Differential Footprints
In addition, you can also use the plotDiffFootprint function to get the activity difference of those TFs that are more different for a certain two samples. Your can plot with Volcano, Bar, or Lollipop plot.
plotDiffFootprint(samples = c("Bulk_B","pDCs"), plot_type = "Lollipop",scale = 4)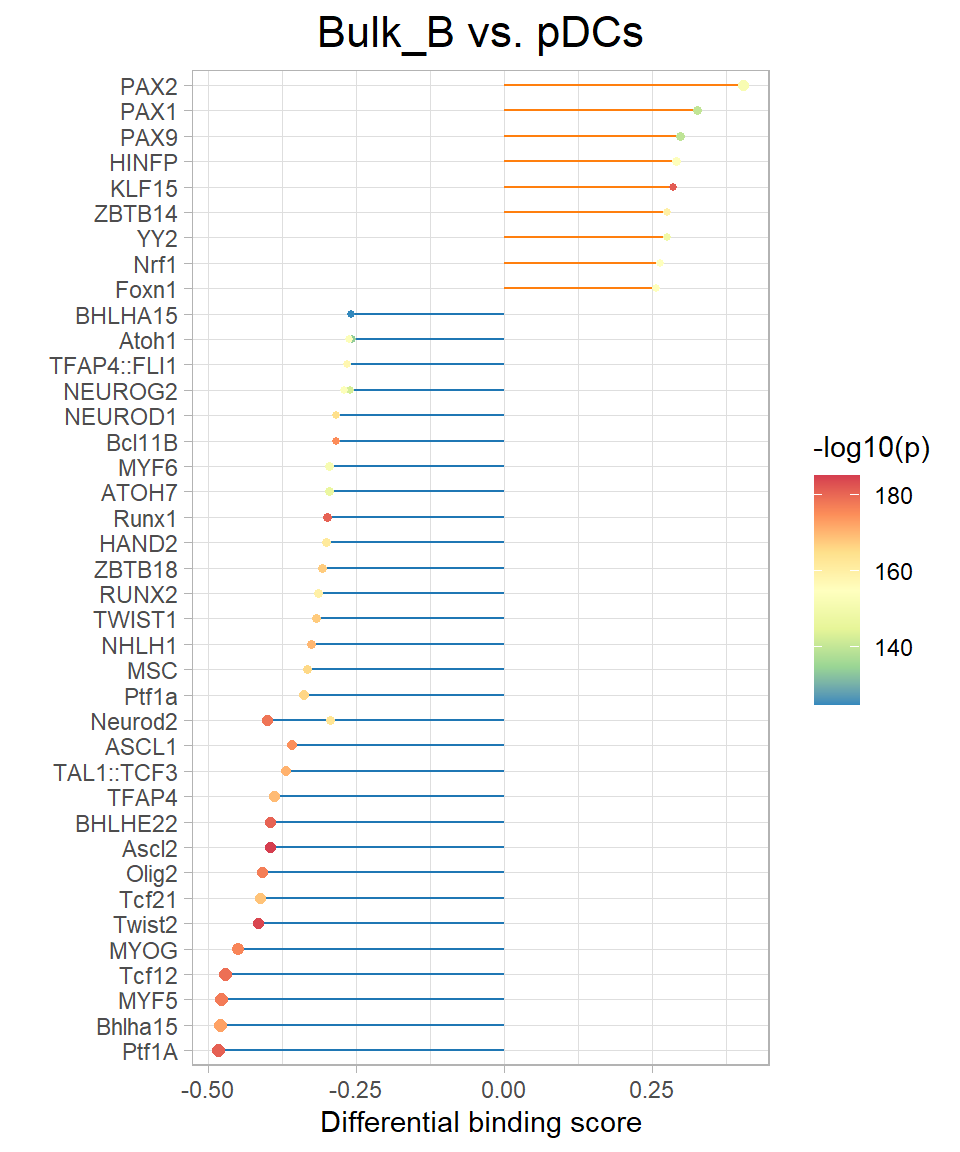
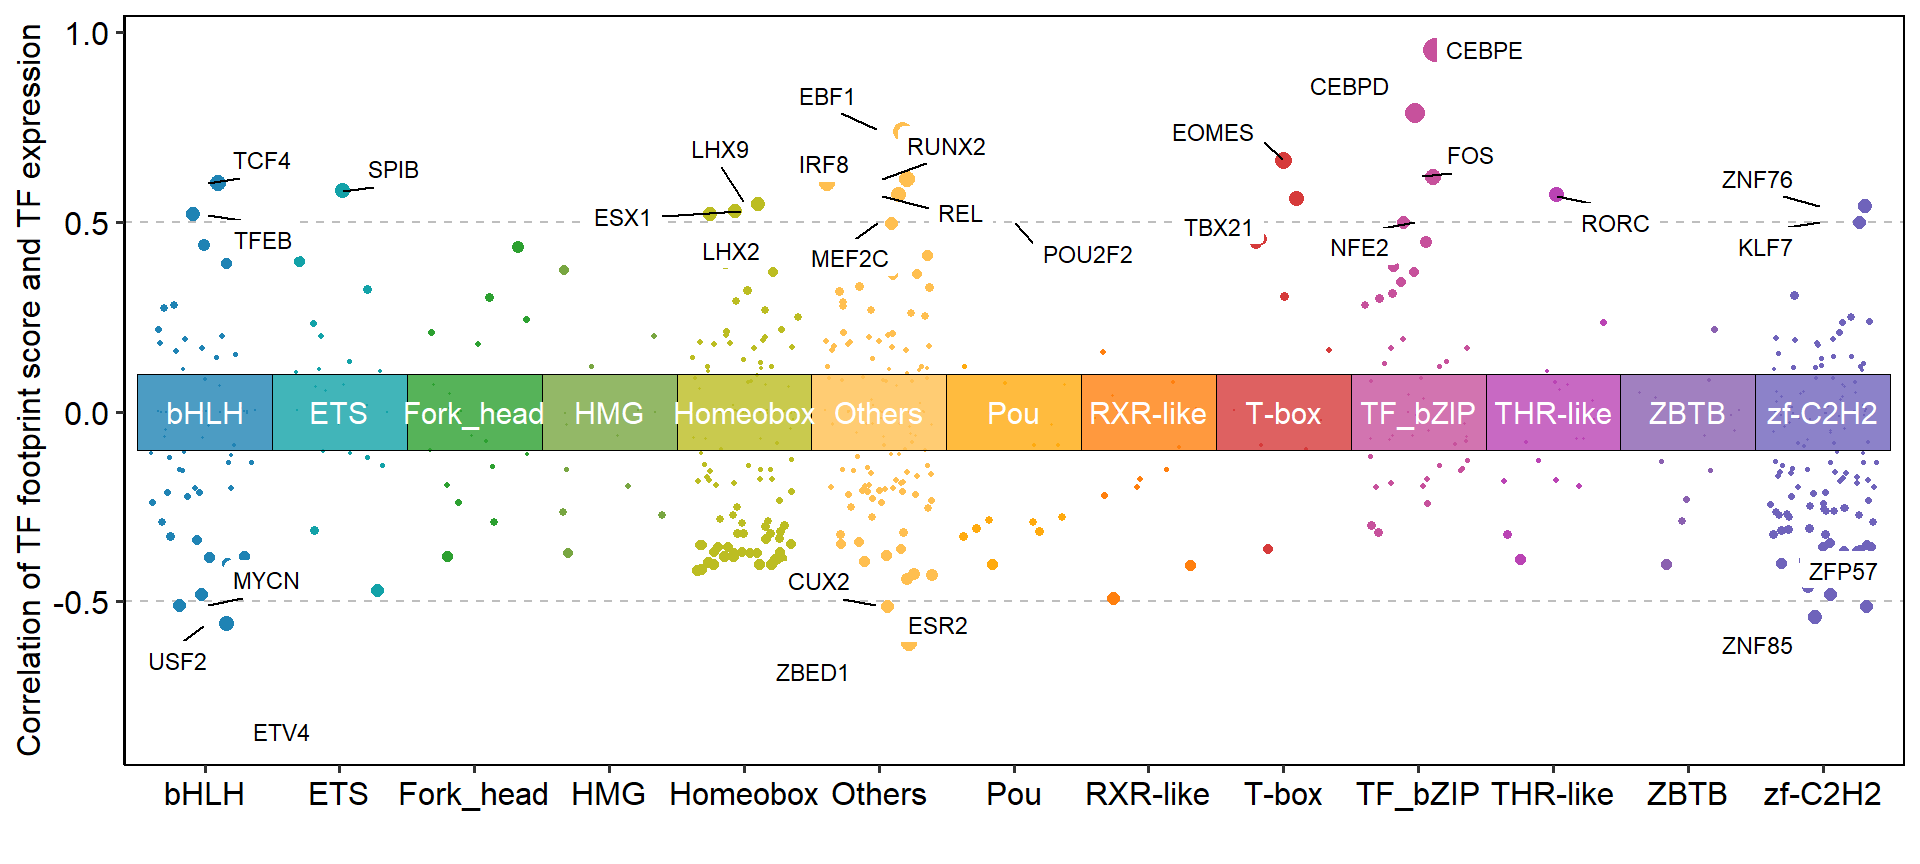
11.5 getMotif2Gene
In some cases, we may be interested in correlating the activity of a TF with its own expression in order to obtain more reliable and important TFs.
For the following analysis, you need to first prepare a tf_family.txt file with the following contents:
##    Symbol         Ensembl   Family
## 1  ZBTB8B ENSG00000273274     ZBTB
## 2    GSX2 ENSG00000180613 Homeobox
## 3    TBX2 ENSG00000121068    T-box
## 4    PAX8 ENSG00000125618      PAX
## 5 CREB3L1 ENSG00000157613  TF_bZIP
## 6 NKX6-1 ENSG00000163623 Homeoboxlibrary(org.Hs.eg.db)We can then use the getMotif2Gene function to match the TF with the gene ID and family information.
m2g <- getMotif2Gene(motif = "F:/cisDynet/example/jaspar.moitf.txt",orgdb = org.Hs.eg.db, tf_family = "F:/cisDynet/example/tf_family.txt")## 'select()' returned 1:many mapping between keys and columnshead(m2g)## ENSEMBL Motif_ID Motif_Name Gene_Name Family
## 1 ENSG00000001167 MA0060.3 NFYA NFYA NF-YA
## 2 ENSG00000005102 MA0661.1 MEOX1 MEOX1 Homeobox
## 3 ENSG00000005513 MA0868.2 SOX8 SOX8 HMG
## 4 ENSG00000006194 MA0528.2 ZNF263 ZNF263 zf-C2H2
## 5 ENSG00000006377 MA0882.1 DLX6 DLX6 Homeobox
## 6 ENSG00000006468 MA0761.2 ETV1 ETV1 ETS