Chapter 5 Peak Overlap Analysis
In this chapter, we will introduce several functions for analyzing the degree of overlap between different peak sets and visualizing them. Theoretically, these functions are not limited to the analysis of ATAC-seq. All files based on the bed format can be analyzed similarly.
5.1 PlotVenn(2 - 6 samples)
We first need to rely on get_bed to get the set of peaks we want to analyze, and then use the get_combine_result function to integrate the computation.
peaks <- list.files(path = "F:/cisDynet/example/peaks/",pattern = "_unique.narrowPeak.bed$", full.names = TRUE)
bed <- get_beds(peaks[1:5])
inputs <- get_combine_result(bed)
We can then use plotVenn to show the common and unique peaks between each peak collection. this function supports up to 6 peak sets as input.
plotVenn(inputs, bed)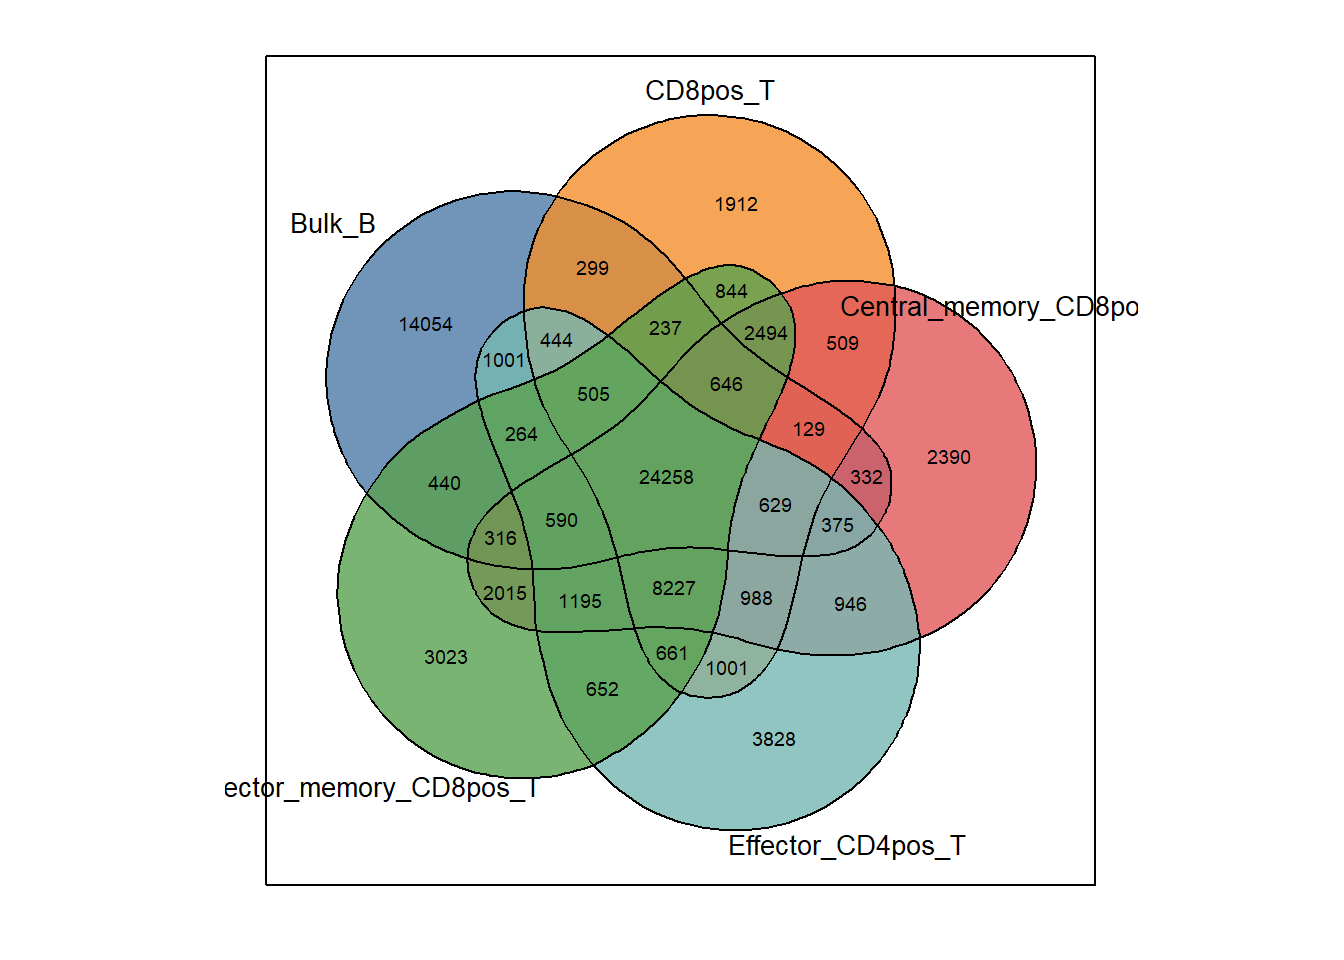
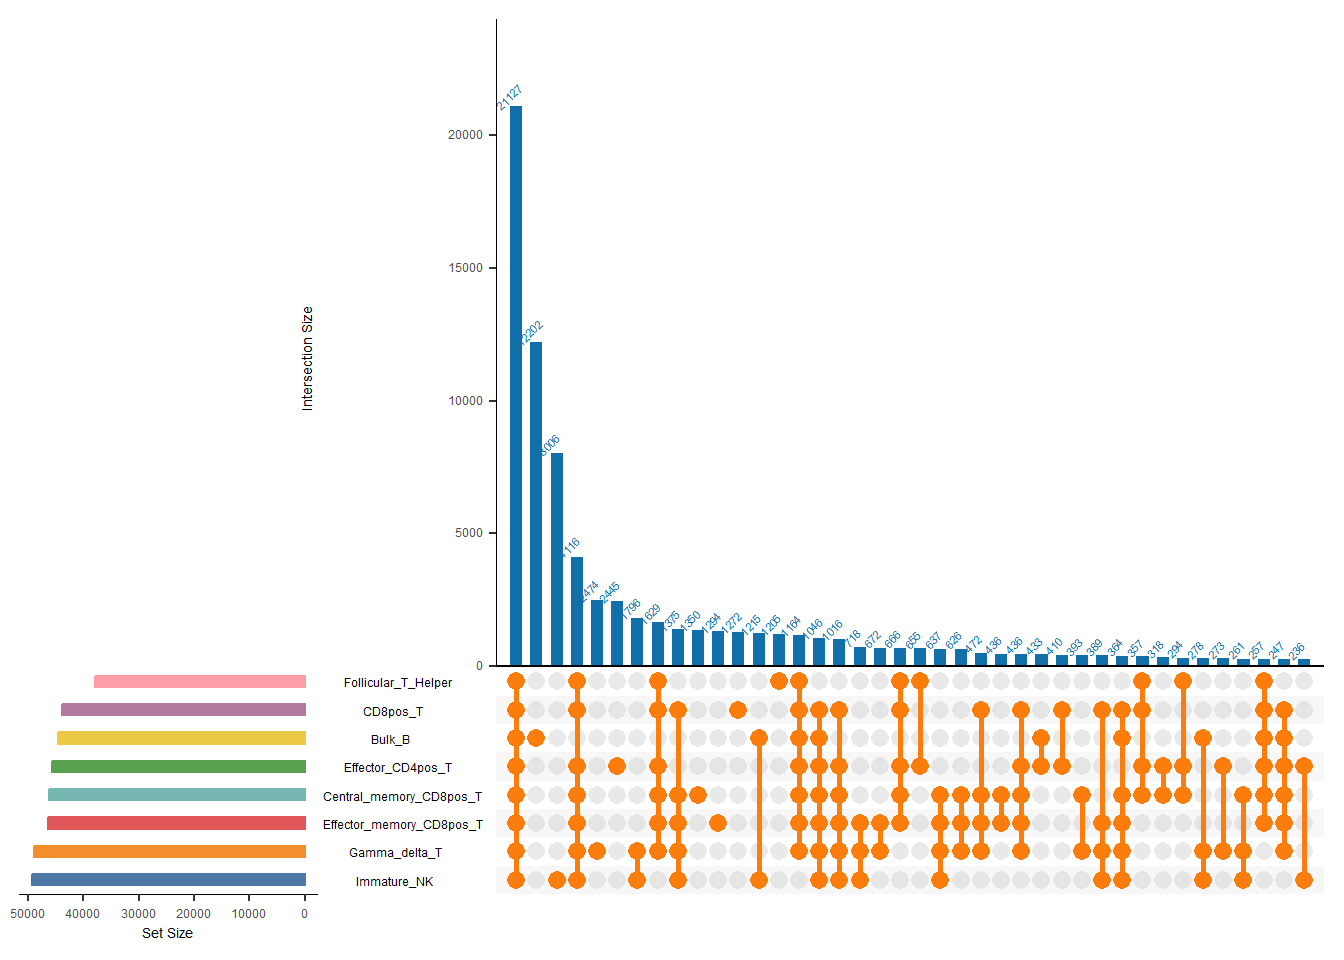
5.2 plotUpSet
When we have more than 6 peak sets, upsets are a better choice.
peaks <- list.files(path = "F:/cisDynet/example/peaks/",pattern = "_unique.narrowPeak.bed$", full.names = TRUE)
bed <- get_beds(peaks[1:8])
inputs <- get_combine_result(bed)
plotUpset(inputs, bed)