Chapter 13 Linking Peak to Gene
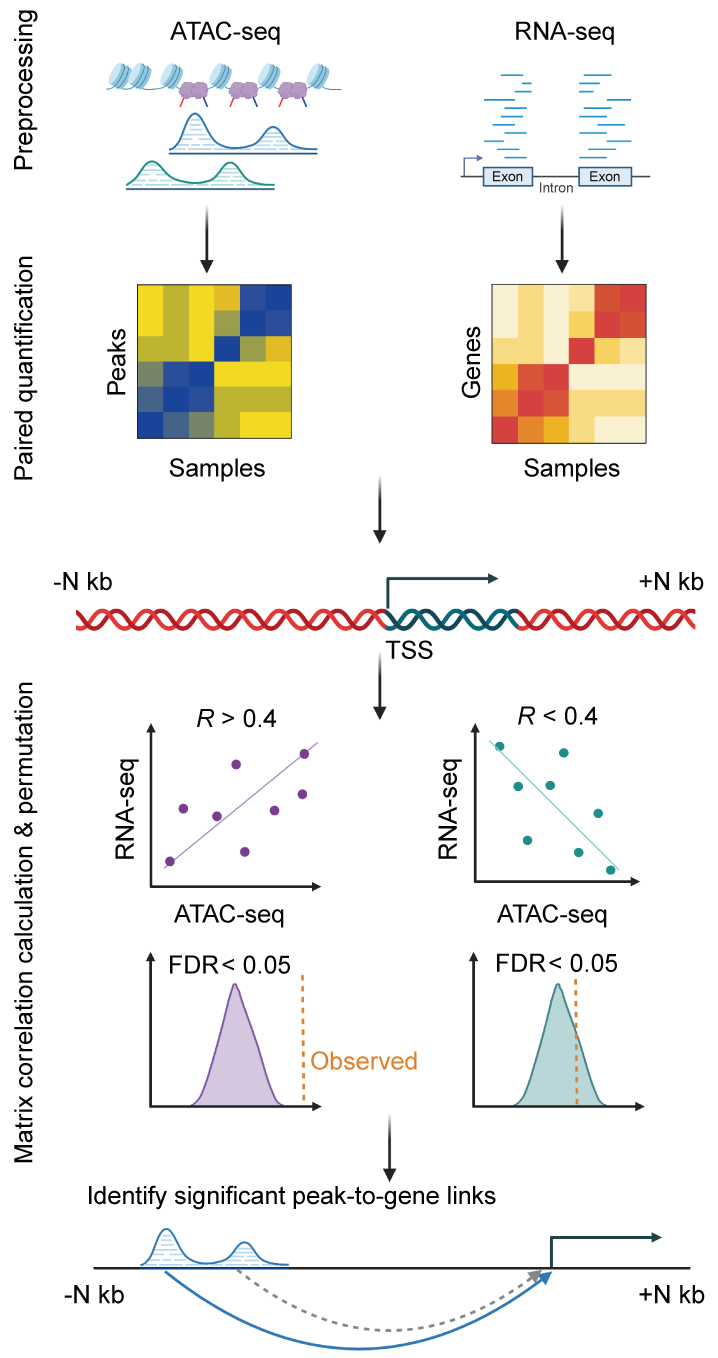
Calculating the correlation coefficient between open chromatin regions (chromatin accessibility regions) and gene expression levels can help us understand the potential associations and regulatory relationships between regulatory elements and target genes. This analysis is highly valuable in gene regulation research and provides the following benefits:
Validating predicted regulatory relationships: Gene regulation is a complex process, where a regulatory element may regulate multiple target genes, and a gene may be regulated by multiple regulatory elements. By calculating the correlation between open chromatin regions and gene expression levels, we can validate predicted regulatory relationships. If there is a significant correlation between open chromatin regions and the expression levels of target genes in cells or tissues, these open chromatin regions may indeed be genuine regulatory elements involved in the regulation of target genes.
Discovering potential regulatory networks: By analyzing the correlation coefficients between multiple open chromatin regions and multiple target genes, we can establish potential regulatory networks, revealing which open chromatin regions may simultaneously regulate multiple target genes or which target genes may be regulated by multiple open chromatin regions. This helps understand the complexity and hierarchy of gene regulatory networks.
Studying the dynamics of gene regulation: Calculating the correlation between open chromatin regions and gene expression levels can be used to study the dynamics of gene regulation. The correlation between open chromatin regions and target genes may change at different time points or under different conditions, providing insights into the dynamic adjustments and responses of gene regulation.
Guiding experimental design: Based on the results of correlation analysis between open chromatin regions and gene expression levels, we can select more promising regulatory element-target gene pairs for experimental validation. This helps save experimental resources and enhances our understanding of regulatory mechanisms.
In summary, calculating the correlation between open chromatin regions and gene expression levels is a common method in gene regulation research. It can reveal potential associations between regulatory elements and target genes, help us understand the complexity and dynamics of gene regulatory networks, and provide important guidance and evidence for subsequent experimental design and mechanism elucidation.
13.1 Get the peak target genes
p2g_res <- getPeak2Gene(atac_matrix = "F:/cisDynet/example/ATAC_CPM_Norm_Data.tsv",
            rna_matrix = "F:/cisDynet/example/RNA_TPM_Norm_Data.tsv",
            peak_annotation = "F:/cisDynet/example/Merged_Peak_annotations.txt",
            max_distance = 50000,N_permutation = 10000,save_path = "F:/cisDynet/example/")
## 2023-10-23 19:24:05 Remove the gene with all expression value is 0.## 2023-10-23 19:24:06 Make the pseudo data for permutation...dim(p2g_res)## [1] 202770 11head(p2g_res)## Peak Gene correlations p.value FDR
## 1 chrX:99869973-99870406 ENSG00000000003 -0.14529548 0.34665095 0.5864034
## 2 chrX:99929727-99930103 ENSG00000000003 -0.28032076 0.06558145 0.2152887
## 3 chrX:99880868-99881053 ENSG00000000003 0.05164087 0.71003896 0.8442624
## 4 chrX:99861688-99862145 ENSG00000000003 -0.23357037 0.12611466 0.3264309
## 5 chrX:99942368-99942965 ENSG00000000003 -0.17170914 0.26391042 0.5046503
## 6 chrX:99940627-99941131 ENSG00000000003 -0.09861108 0.52877581 0.7282334
## Type PeakSummit TSS Summit2TSS strand orientation
## 1 Distal 99870189 99894988 -24799 - Downstream
## 2 Intragenic 99929915 99894988 34927 - Upstream
## 3 Distal 99880960 99894988 -14028 - Downstream
## 4 Distal 99861916 99894988 -33072 - Downstream
## 5 Intragenic 99942666 99894988 47678 - Upstream
## 6 Intragenic 99940879 99894988 45891 - Upstream13.2 Plot all the significant peak2gene links
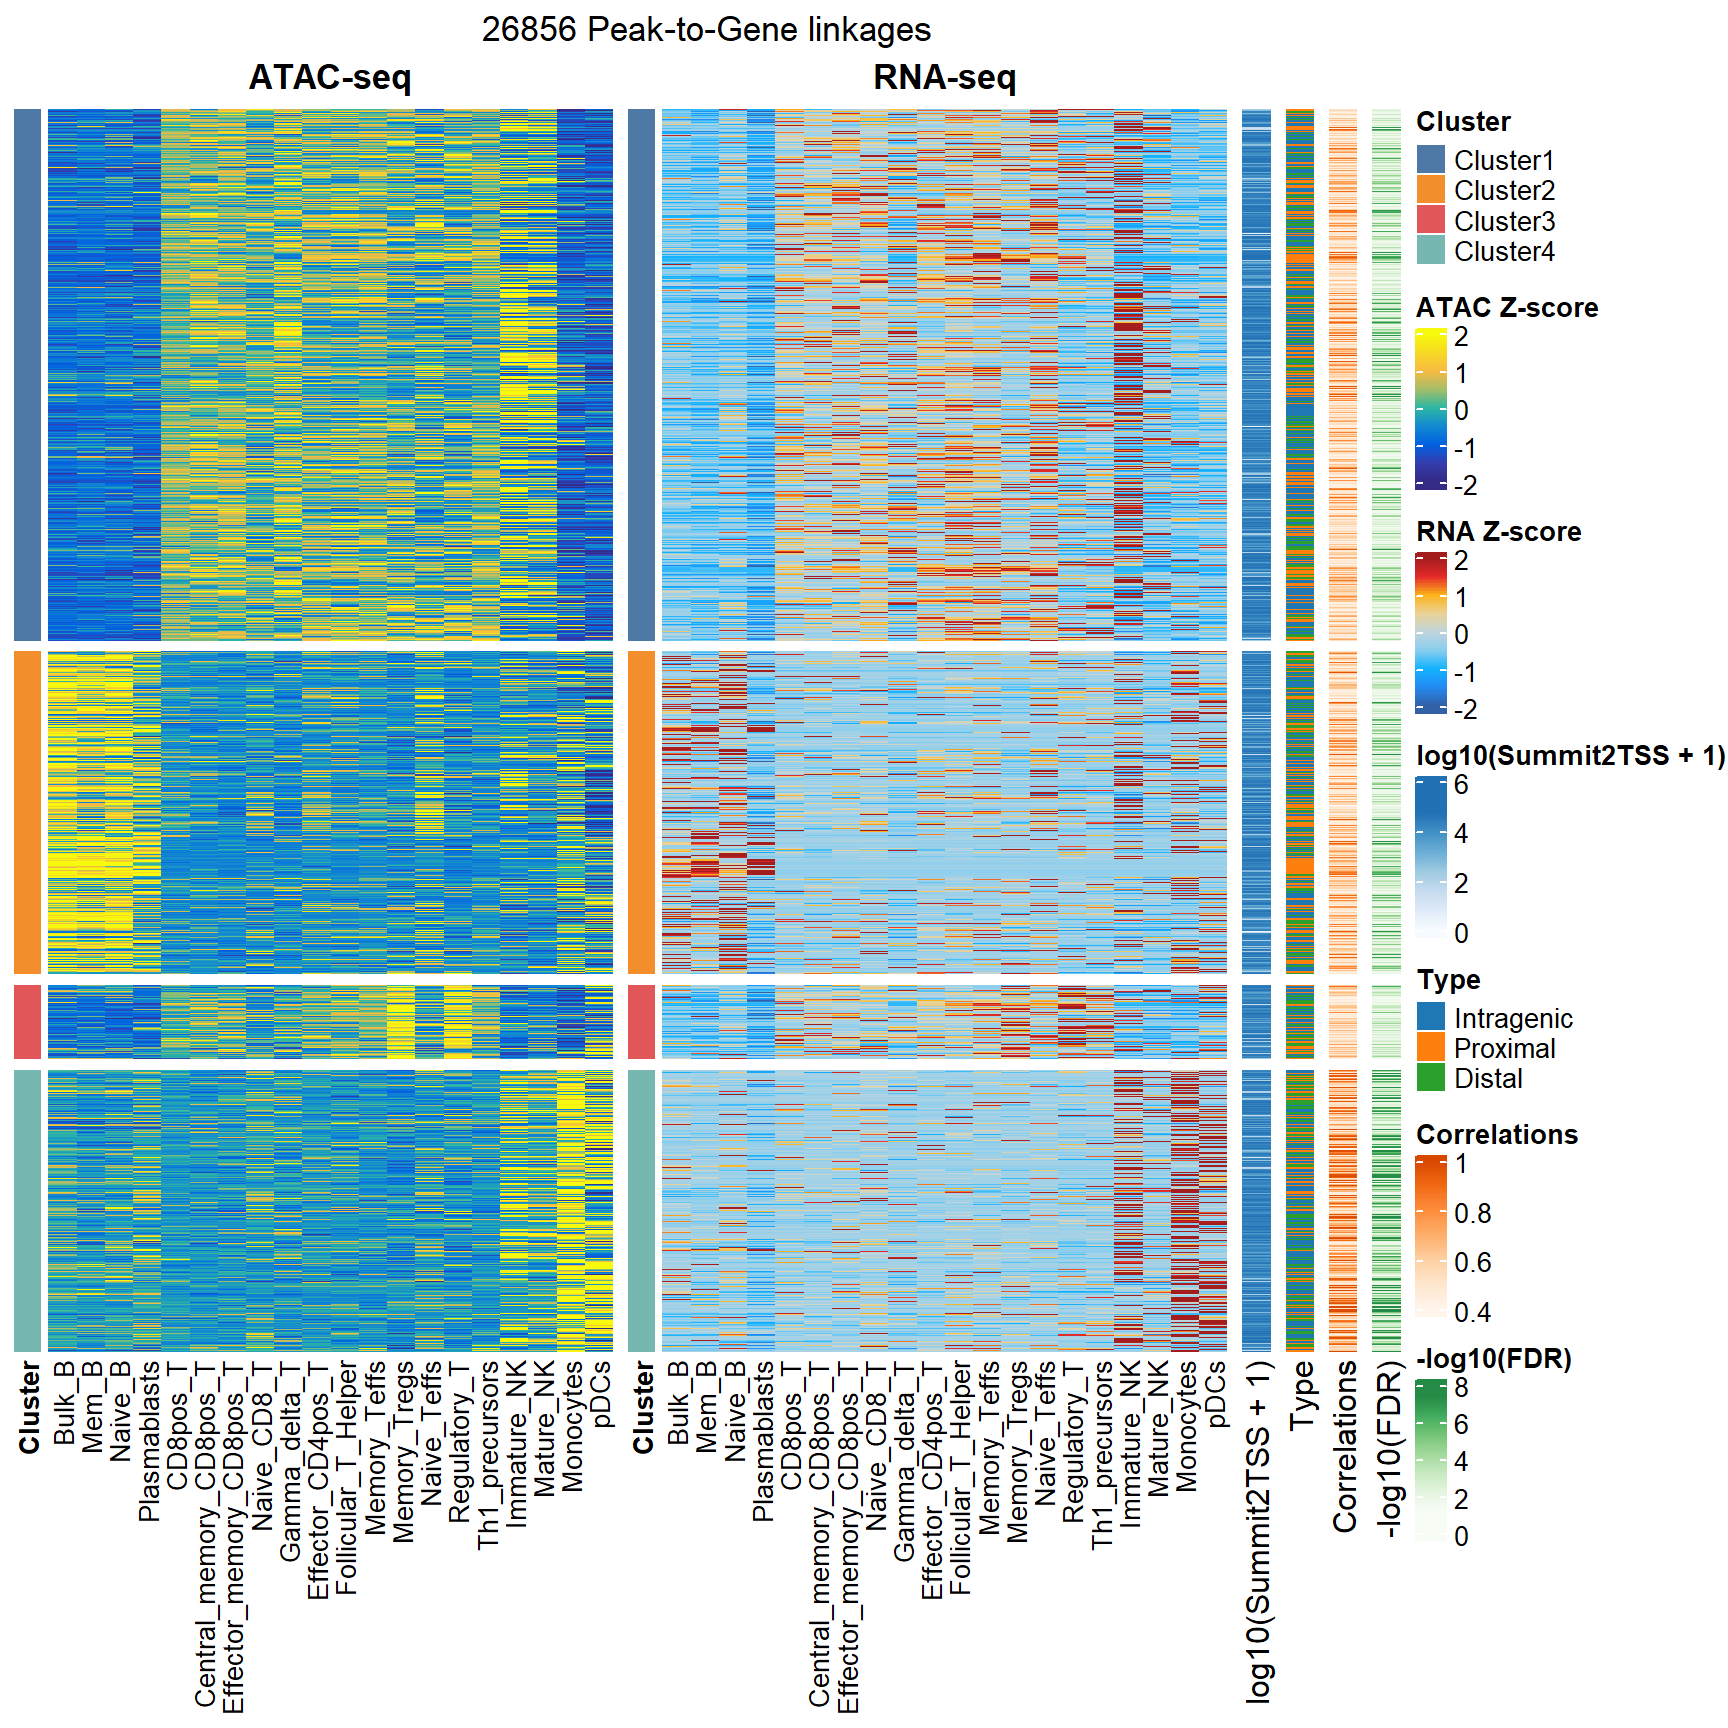
We can use the plotP2GHeatmap function to show all significant peak-to-gene linkages in a combined heatmap.
plotP2GHeatmap(p2g_res = "F:/cisDynet/example/Peak2Gene_All_Links.rds",
              cor_cutoff = 0.4,
              atac_matrix = "F:/cisDynet/example/ATAC_CPM_Norm_Data.tsv",
              rna_matrix = "F:/cisDynet/example/RNA_TPM_Norm_Data.tsv")
## 2023-10-23 20:30:40 Depending on the cutoff. The Peak2Gene links number: 26856## 2023-10-23 20:30:42 Calculating ATAC matrix.## 2023-10-23 20:31:07 Calculating RNA matrix.