Chapter 12 Co-accessibility
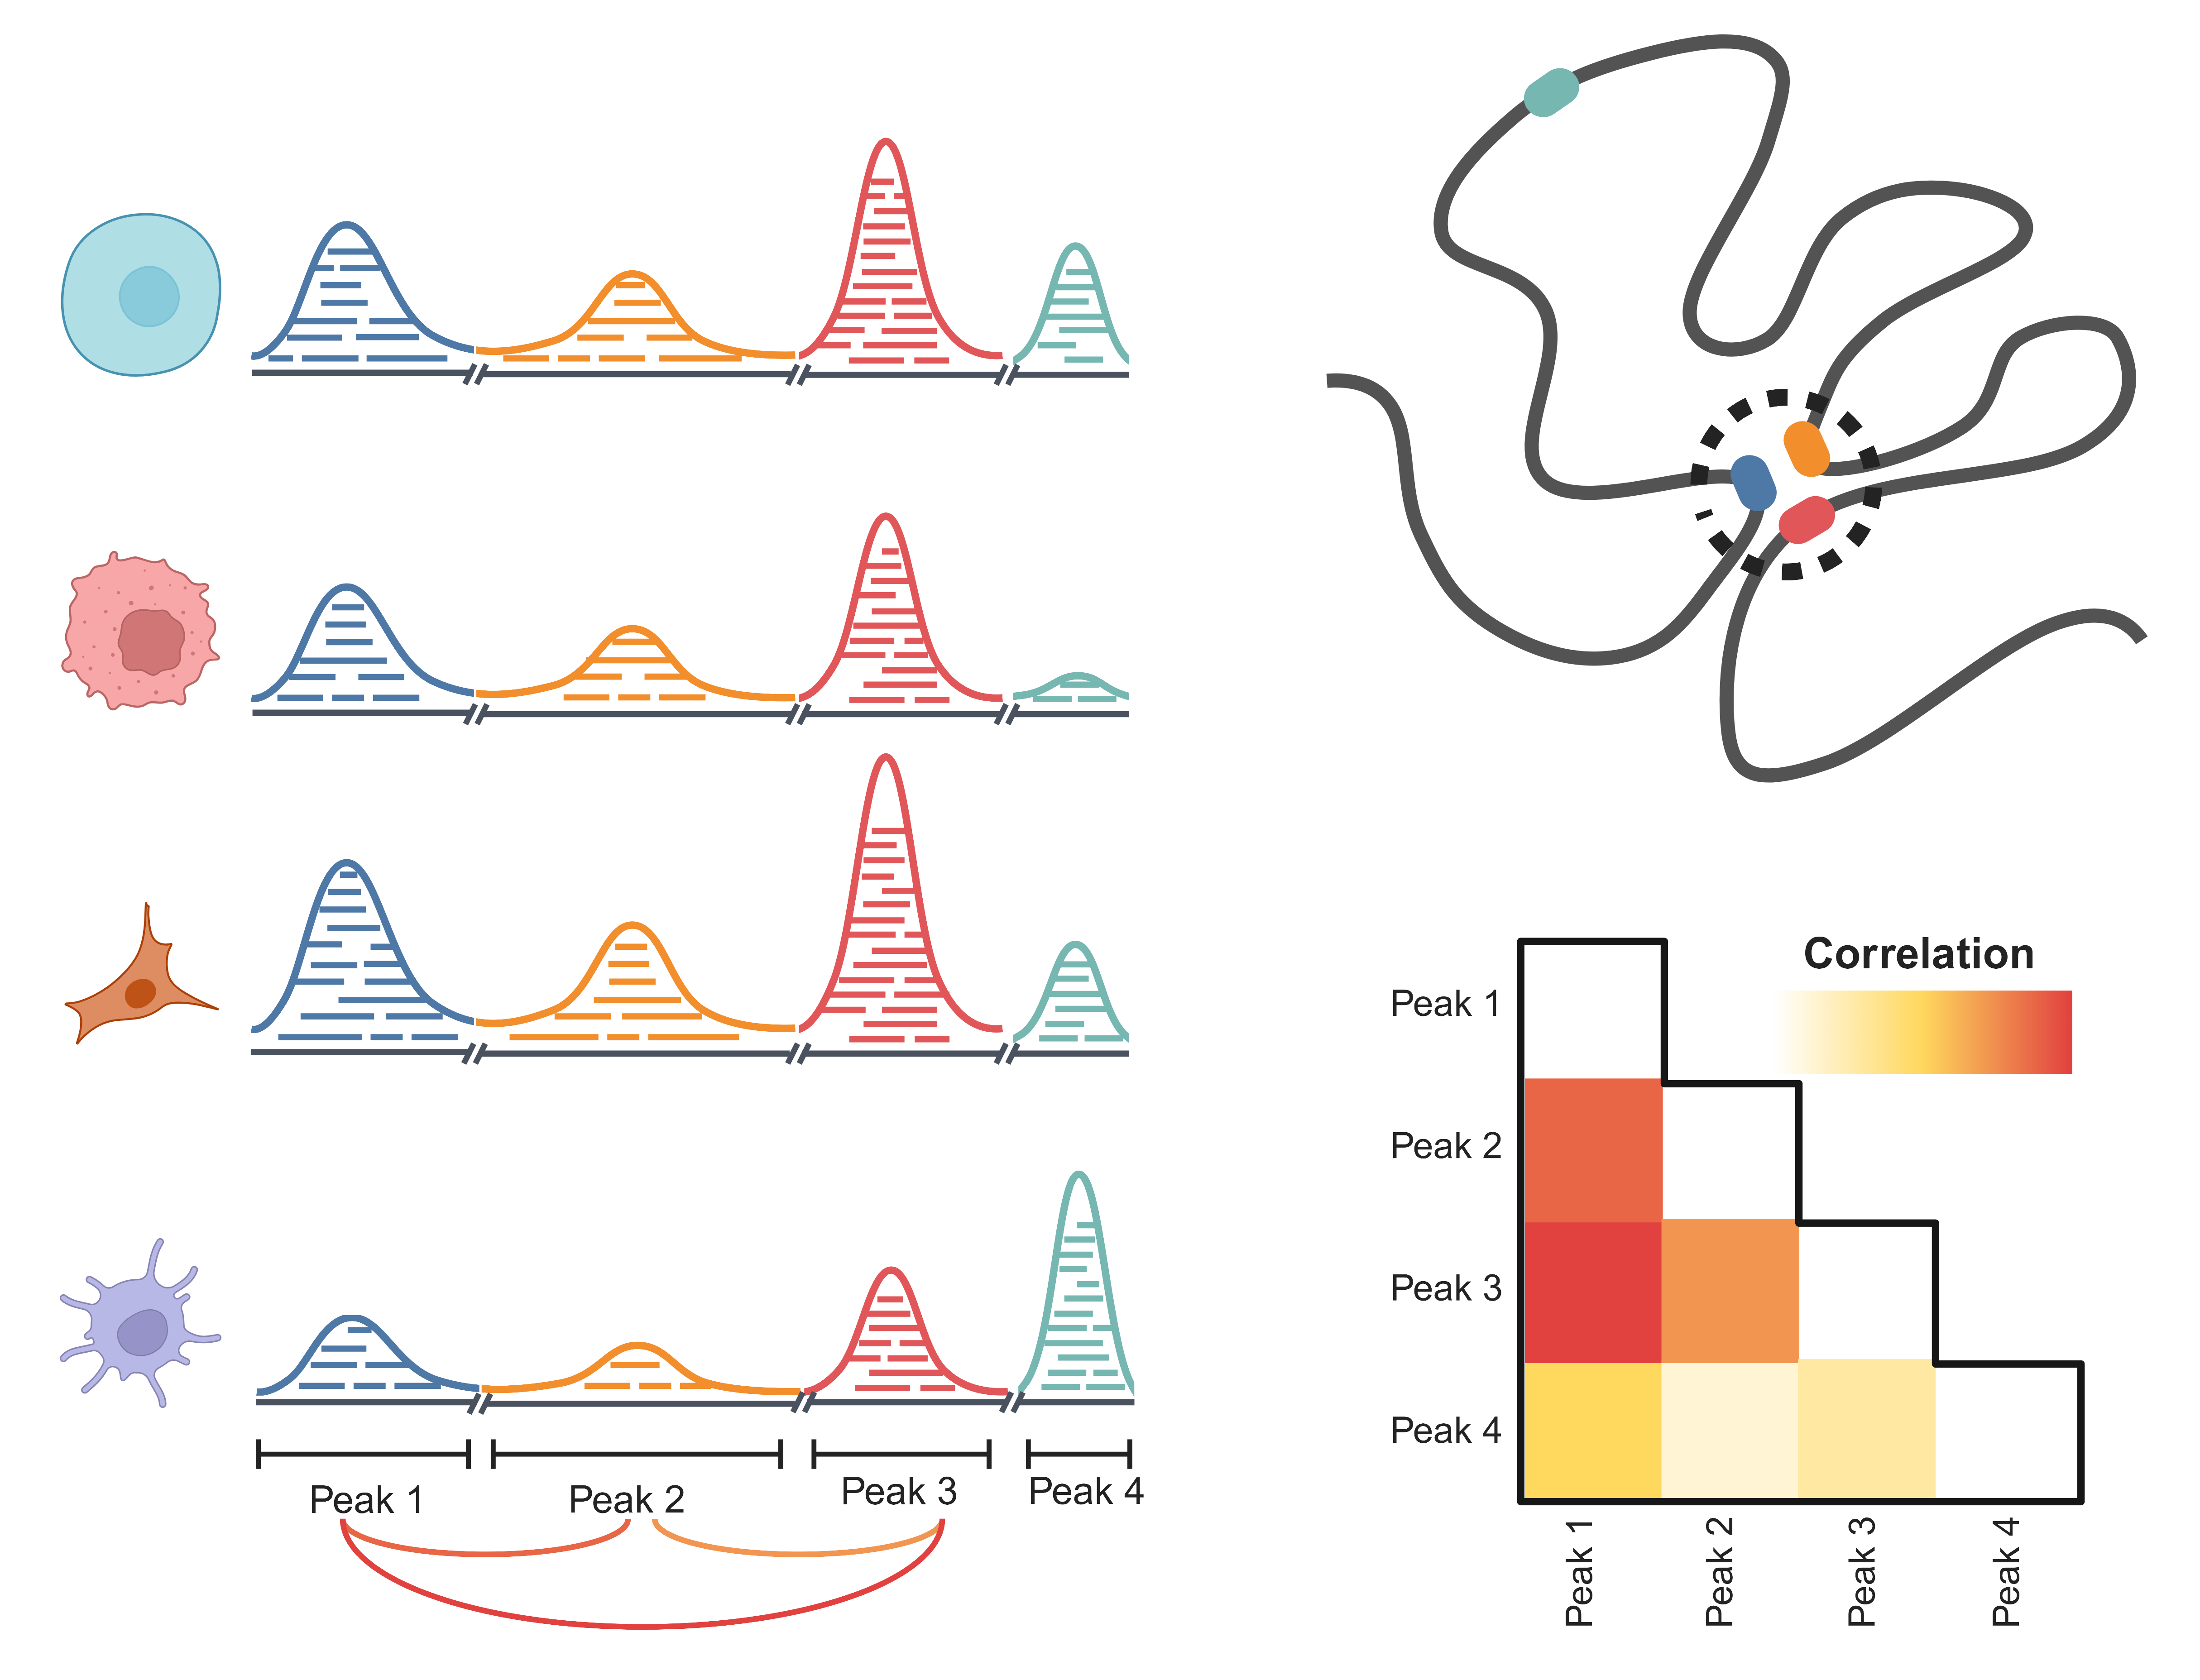
Co-accessibility of chromatin refers to the phenomenon where different genomic regions are simultaneously open under certain conditions. In the three-dimensional spatial structure of chromatin, certain regions of the genome may interact with each other in specific cell states or biological conditions, resulting in their simultaneous open state. These regions that are simultaneously open are referred to as co-accessible regions.
The co-accessibility phenomenon reflects the non-randomness of chromatin and the characteristics of its spatial structure. Co-accessible regions may contain co-regulated genes, indicating functional connections between genes in these regions.
12.1 Co-accessibility calaulation
We begin by annotating the peak using the annoMergedPeaks function as mentioned earlier. We can use the getCoaccessible function to do the calculation easily.
colist <- getCoaccessible(peak_anno = "F:/cisDynet/example/Merged_Peak_annotations.txt",
                          quant_matrix = "F:/cisDynet/example/ATAC_CPM_Norm_Data.tsv",
                          window = 100000)
## 2023-10-23 15:43:42 Co-accessibility with chr1.## 2023-10-23 15:45:28 Co-accessibility with chr2.## 2023-10-23 15:47:05 Co-accessibility with chr3.## 2023-10-23 15:48:32 Co-accessibility with chr4.## 2023-10-23 15:49:15 Co-accessibility with chr5.## 2023-10-23 15:50:35 Co-accessibility with chr6.## 2023-10-23 15:52:05 Co-accessibility with chr7.## 2023-10-23 15:53:11 Co-accessibility with chr8.## 2023-10-23 15:54:12 Co-accessibility with chr9.## 2023-10-23 15:55:01 Co-accessibility with chr10.## 2023-10-23 15:55:59 Co-accessibility with chr11.## 2023-10-23 15:57:51 Co-accessibility with chr12.## 2023-10-23 15:59:01 Co-accessibility with chr13.## 2023-10-23 15:59:45 Co-accessibility with chr14.## 2023-10-23 16:00:42 Co-accessibility with chr15.## 2023-10-23 16:01:21 Co-accessibility with chr16.## 2023-10-23 16:02:24 Co-accessibility with chr17.## 2023-10-23 16:03:06 Co-accessibility with chr18.## 2023-10-23 16:03:47 Co-accessibility with chr19.## 2023-10-23 16:04:18 Co-accessibility with chr20.## 2023-10-23 16:04:49 Co-accessibility with chr21.## 2023-10-23 16:05:41 Co-accessibility with chr22.## 2023-10-23 16:07:16 Co-accessibility with chrX.## 2023-10-23 16:07:44 Co-accessibility with chrY.## 2023-10-23 16:08:01 Preparing the result!head(colist)## Peak1 Peak2 coaccess dist Center1
## 4 chr1:10002429-10002916 chr1:10002983-10003799 0.30534094 719 10002672
## 5 chr1:10002429-10002916 chr1:10010299-10011452 0.28963899 8203 10002672
## 6 chr1:10002429-10002916 chr1:10020974-10021652 0.15730060 18641 10002672
## 7 chr1:10002429-10002916 chr1:10056970-10058115 -0.03345636 54870 10002672
## 8 chr1:10002429-10002916 chr1:10092544-10093695 0.32942671 90447 10002672
## 9 chr1:10002429-10002916 chr1:100151228-100151645 0.06887030 90148764 10002672
## Center2 dist10k dist2k colevel group
## 4 10003391 0 0 High Promoter-Promoter
## 5 10010875 1 8000 High Promoter-Enhancer
## 6 10021313 2 18000 High Promoter-Enhancer
## 7 10057542 5 54000 Medium Promoter-Promoter
## 8 10093119 9 90000 High Promoter-Enhancer
## 9 100151436 9015 90148000 Medium Promoter-Enhancer12.2 Plotting browser tracks of Co-accessibility
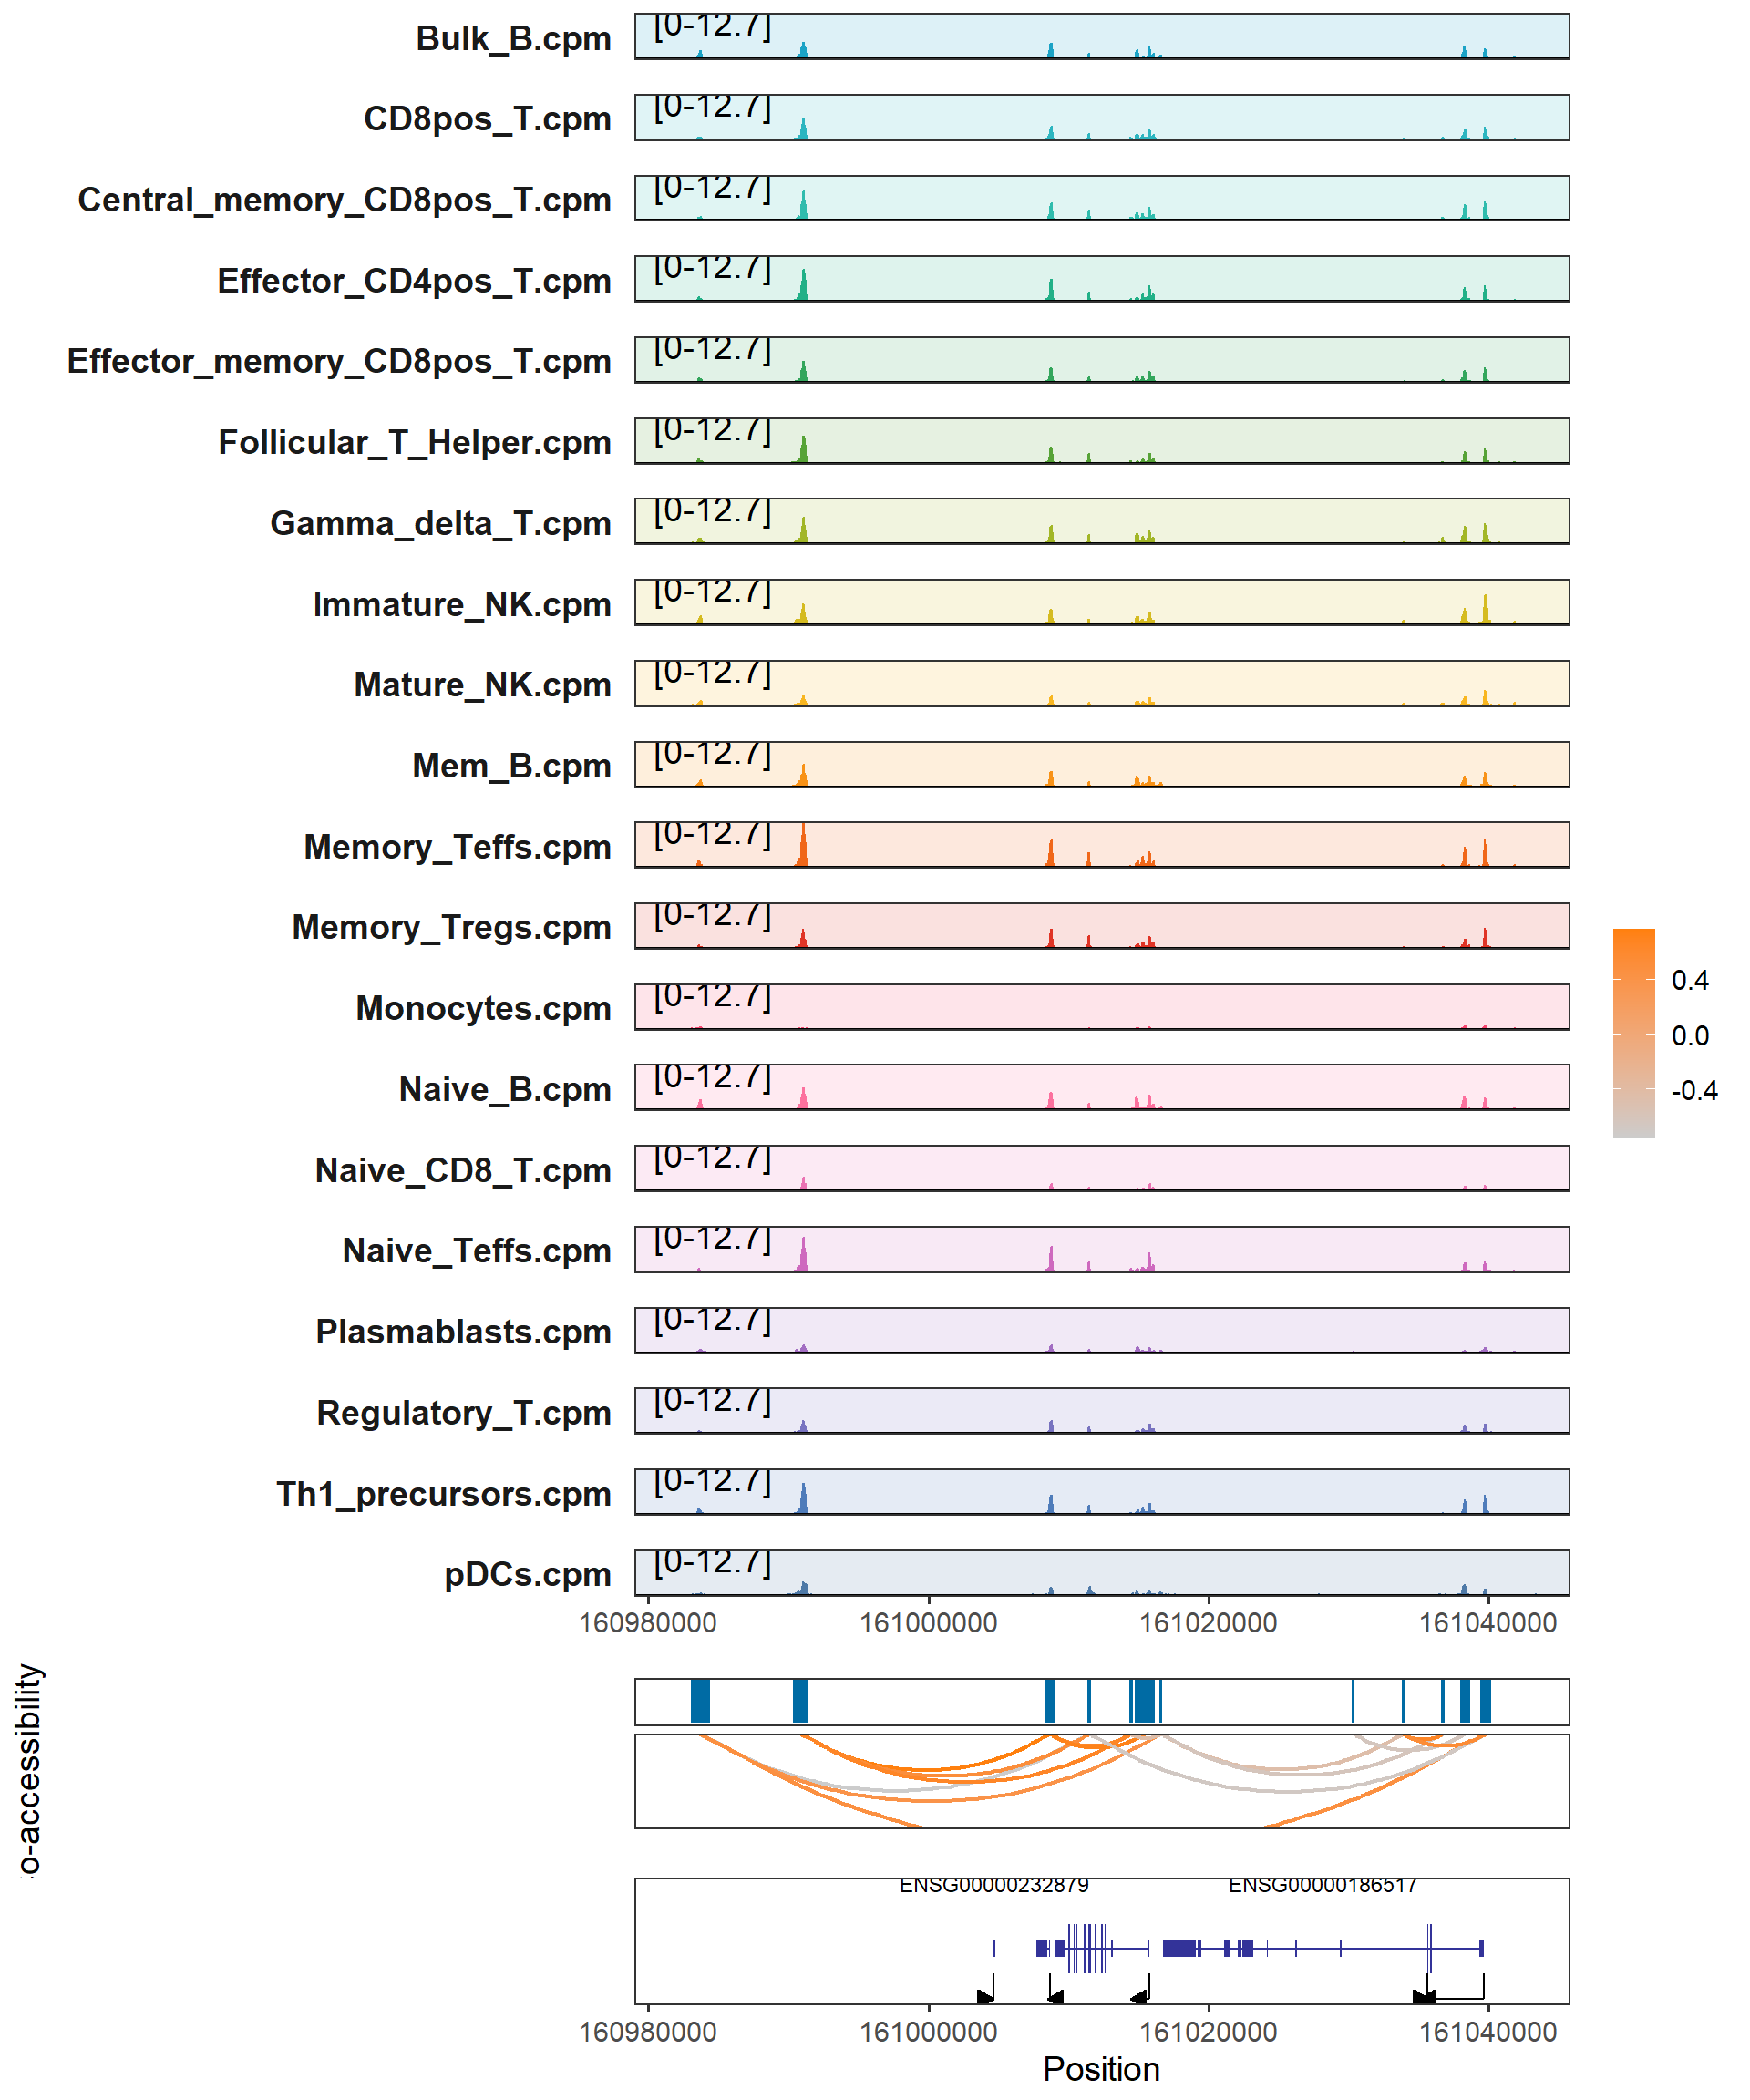
We can use the plotCoGeneTracks function to visualize the co-opening of specific genes(plotCoGeneTracks) / intervals(plotCoTracks).
plotCoGeneTracks(samples_path = "F:/cisDynet/example/signal/",
                 samples_suffix = ".cpm.bw",
                 gene_name = "ENSG00000158773",
                 peaks = "F:/cisDynet/example/MergedPeaks.bed",
                 colist = "F:/cisDynet/example/coaccess_result.rds")