Chapter 15 GWAS Trait SNPs Enrichment
GWAS typically identifies SNP loci associated with complex traits and diseases. However, these SNPs often reside in non-coding regions (e.g., introns, proximal to promoters), making their functional interpretation challenging.
Conducting enrichment analysis of GWAS-associated SNPs with ATAC-seq open chromatin regions provides information on whether these SNPs are located within regulatory regions, helping to better annotate and interpret their functions.
15.1 Workflows
Union of Peak Regions: Combine peak regions present across different cell types to create a unified set of peak regions. This involves taking the union of peaks identified in each cell type to get a comprehensive set of peaks that occur in any of the cell types.
Construct Matrix of Normalized Read Counts: For each peak region and each cell type, calculate the normalized read counts. This involves quantifying the read counts of sequencing data within each peak region and then normalizing them to account for differences in sequencing depth and other factors.
Calculate Specificity Scores: For each peak in each cell type, calculate the specificity score. The specificity score is a measure of how specific a peak is to a particular cell type. It is calculated as the normalized read count for that peak in that cell type divided by the square root of the sum of the squared normalized read counts for that peak across all cell types.
Define SNP Set: Identify a set of lead-SNPs and those with high linkage disequilibrium (LD) with r2 > 0.8. These SNPs are likely to be associated with specific traits or diseases of interest.
Overlay SNPs to Peaks: Associate the identified SNPs with the peak regions. This step aims to identify which peaks overlap with the associated variants (lead-SNPs and high LD SNPs).
Calculate Mean Specificity Ranks: For the peaks that overlap with associated variants, calculate the mean specificity ranks. This likely involves averaging the specificity scores for those peaks across different cell types.
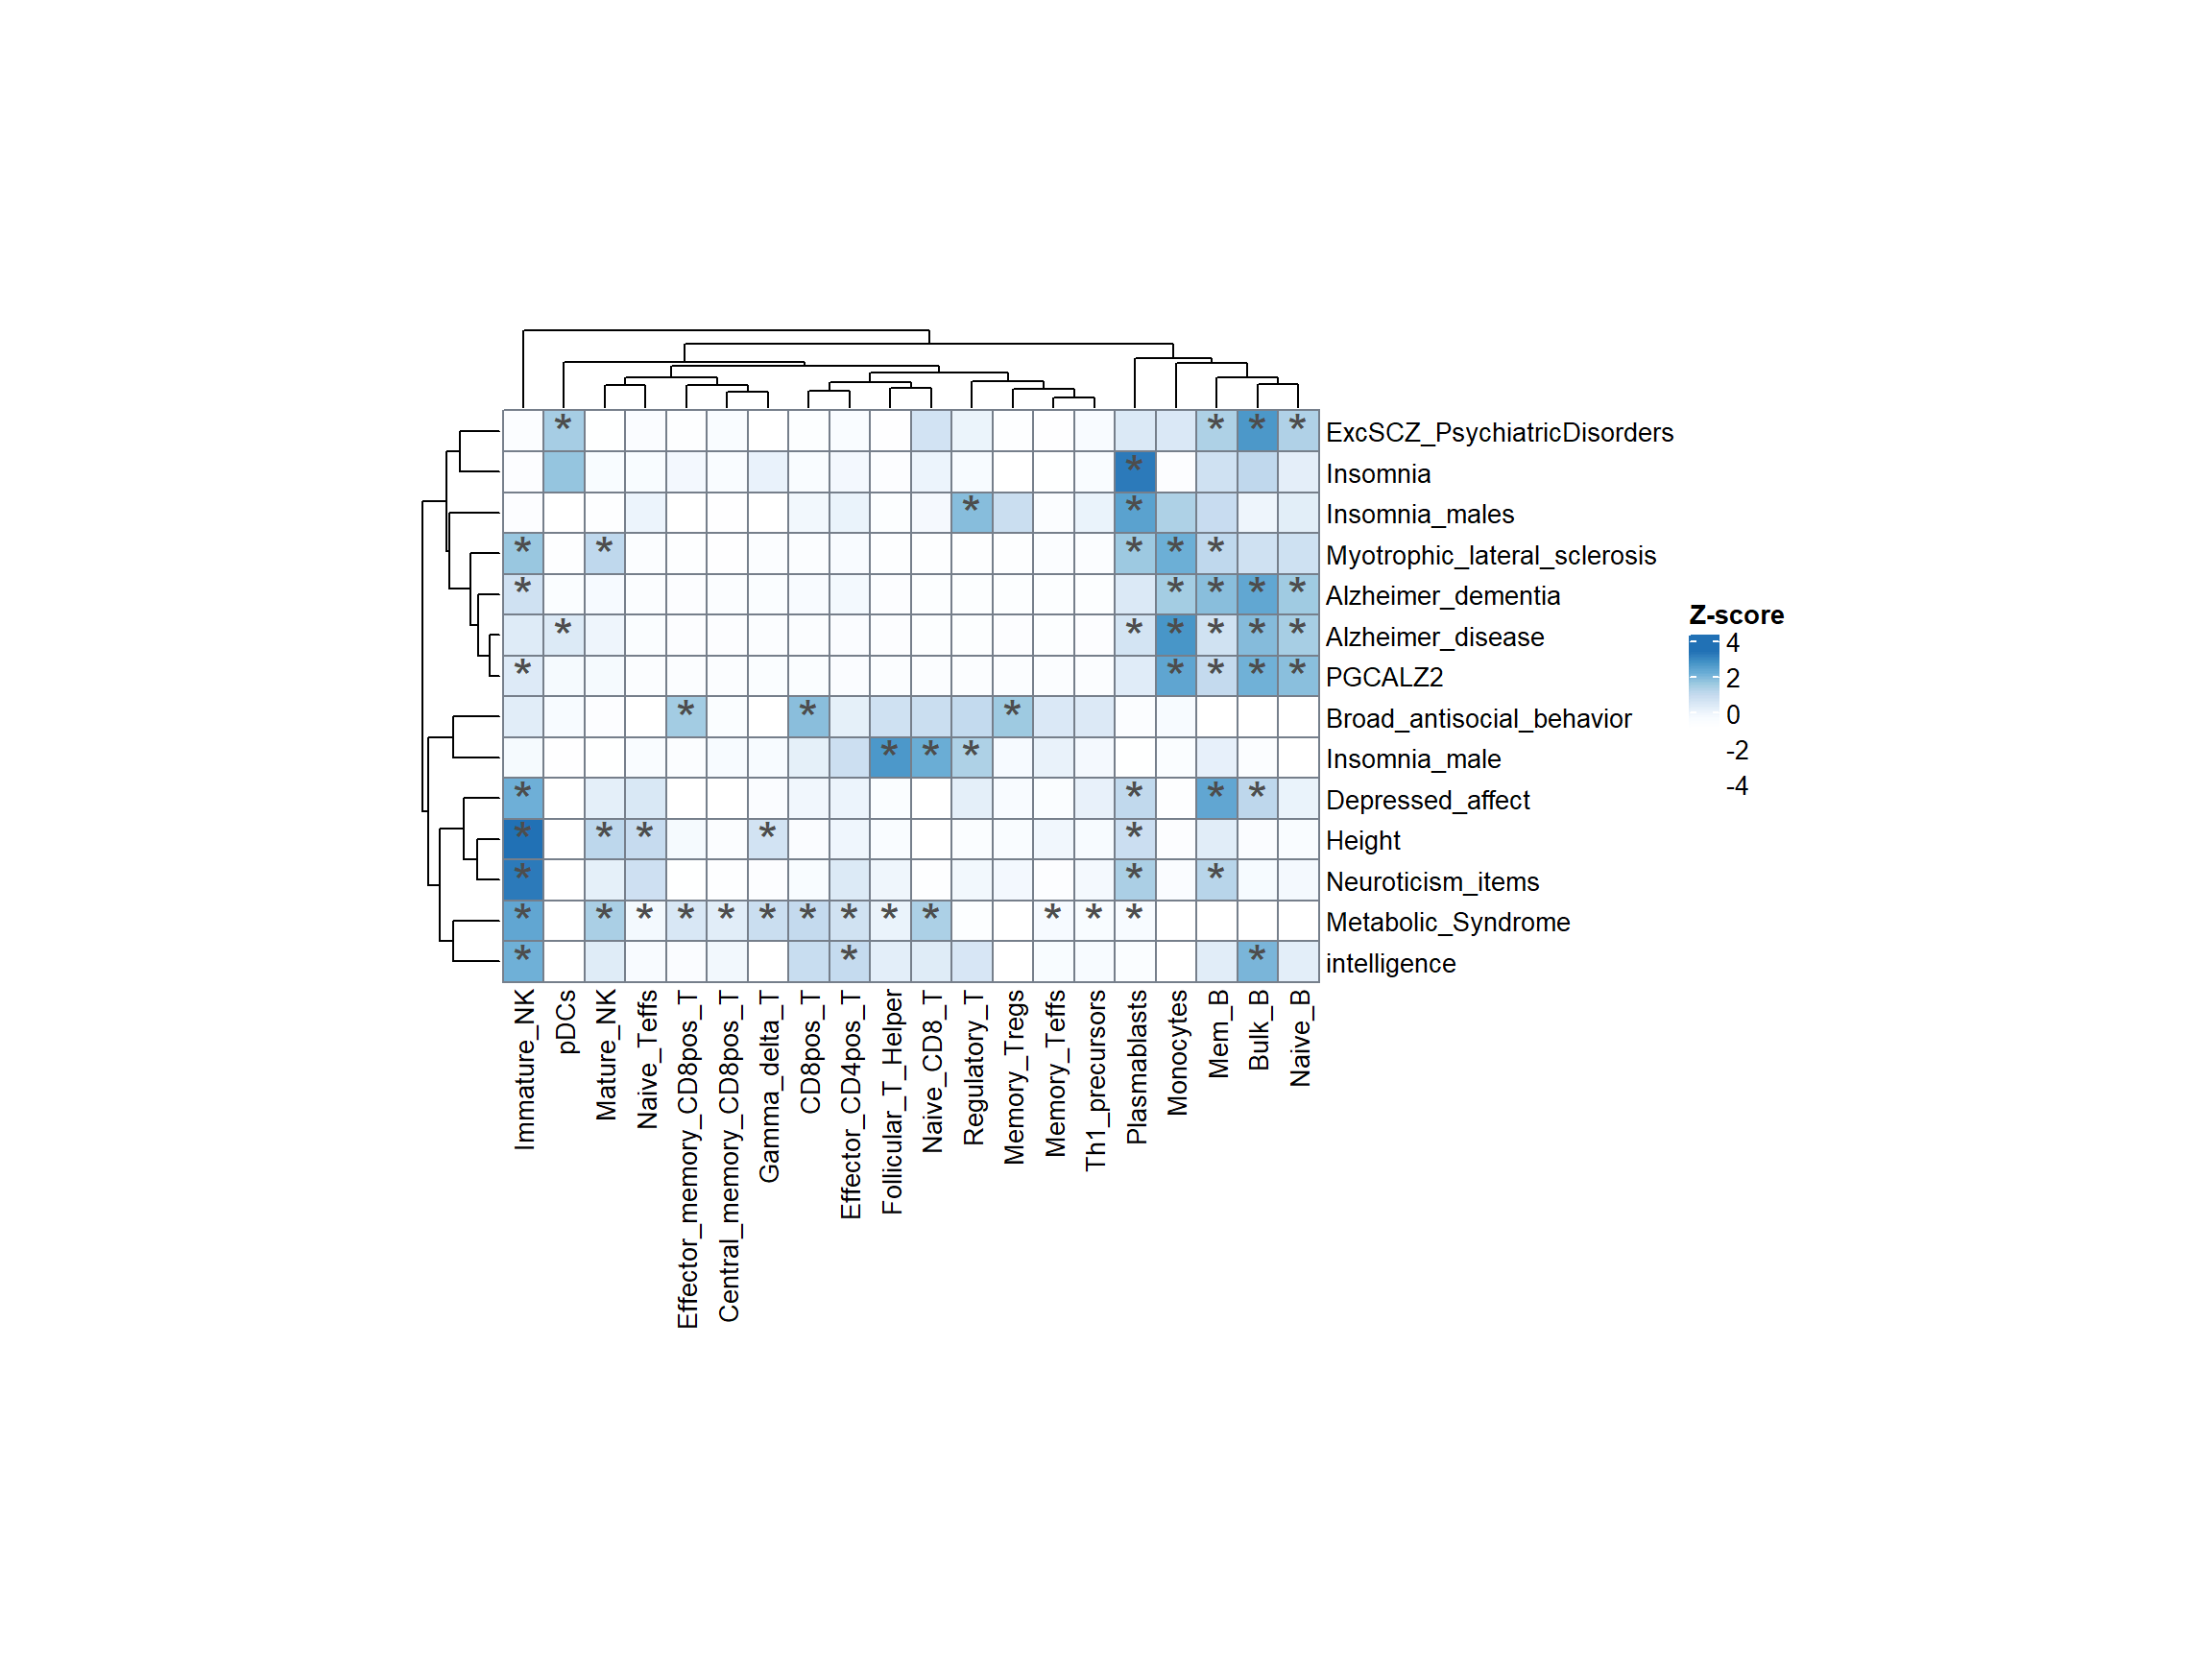
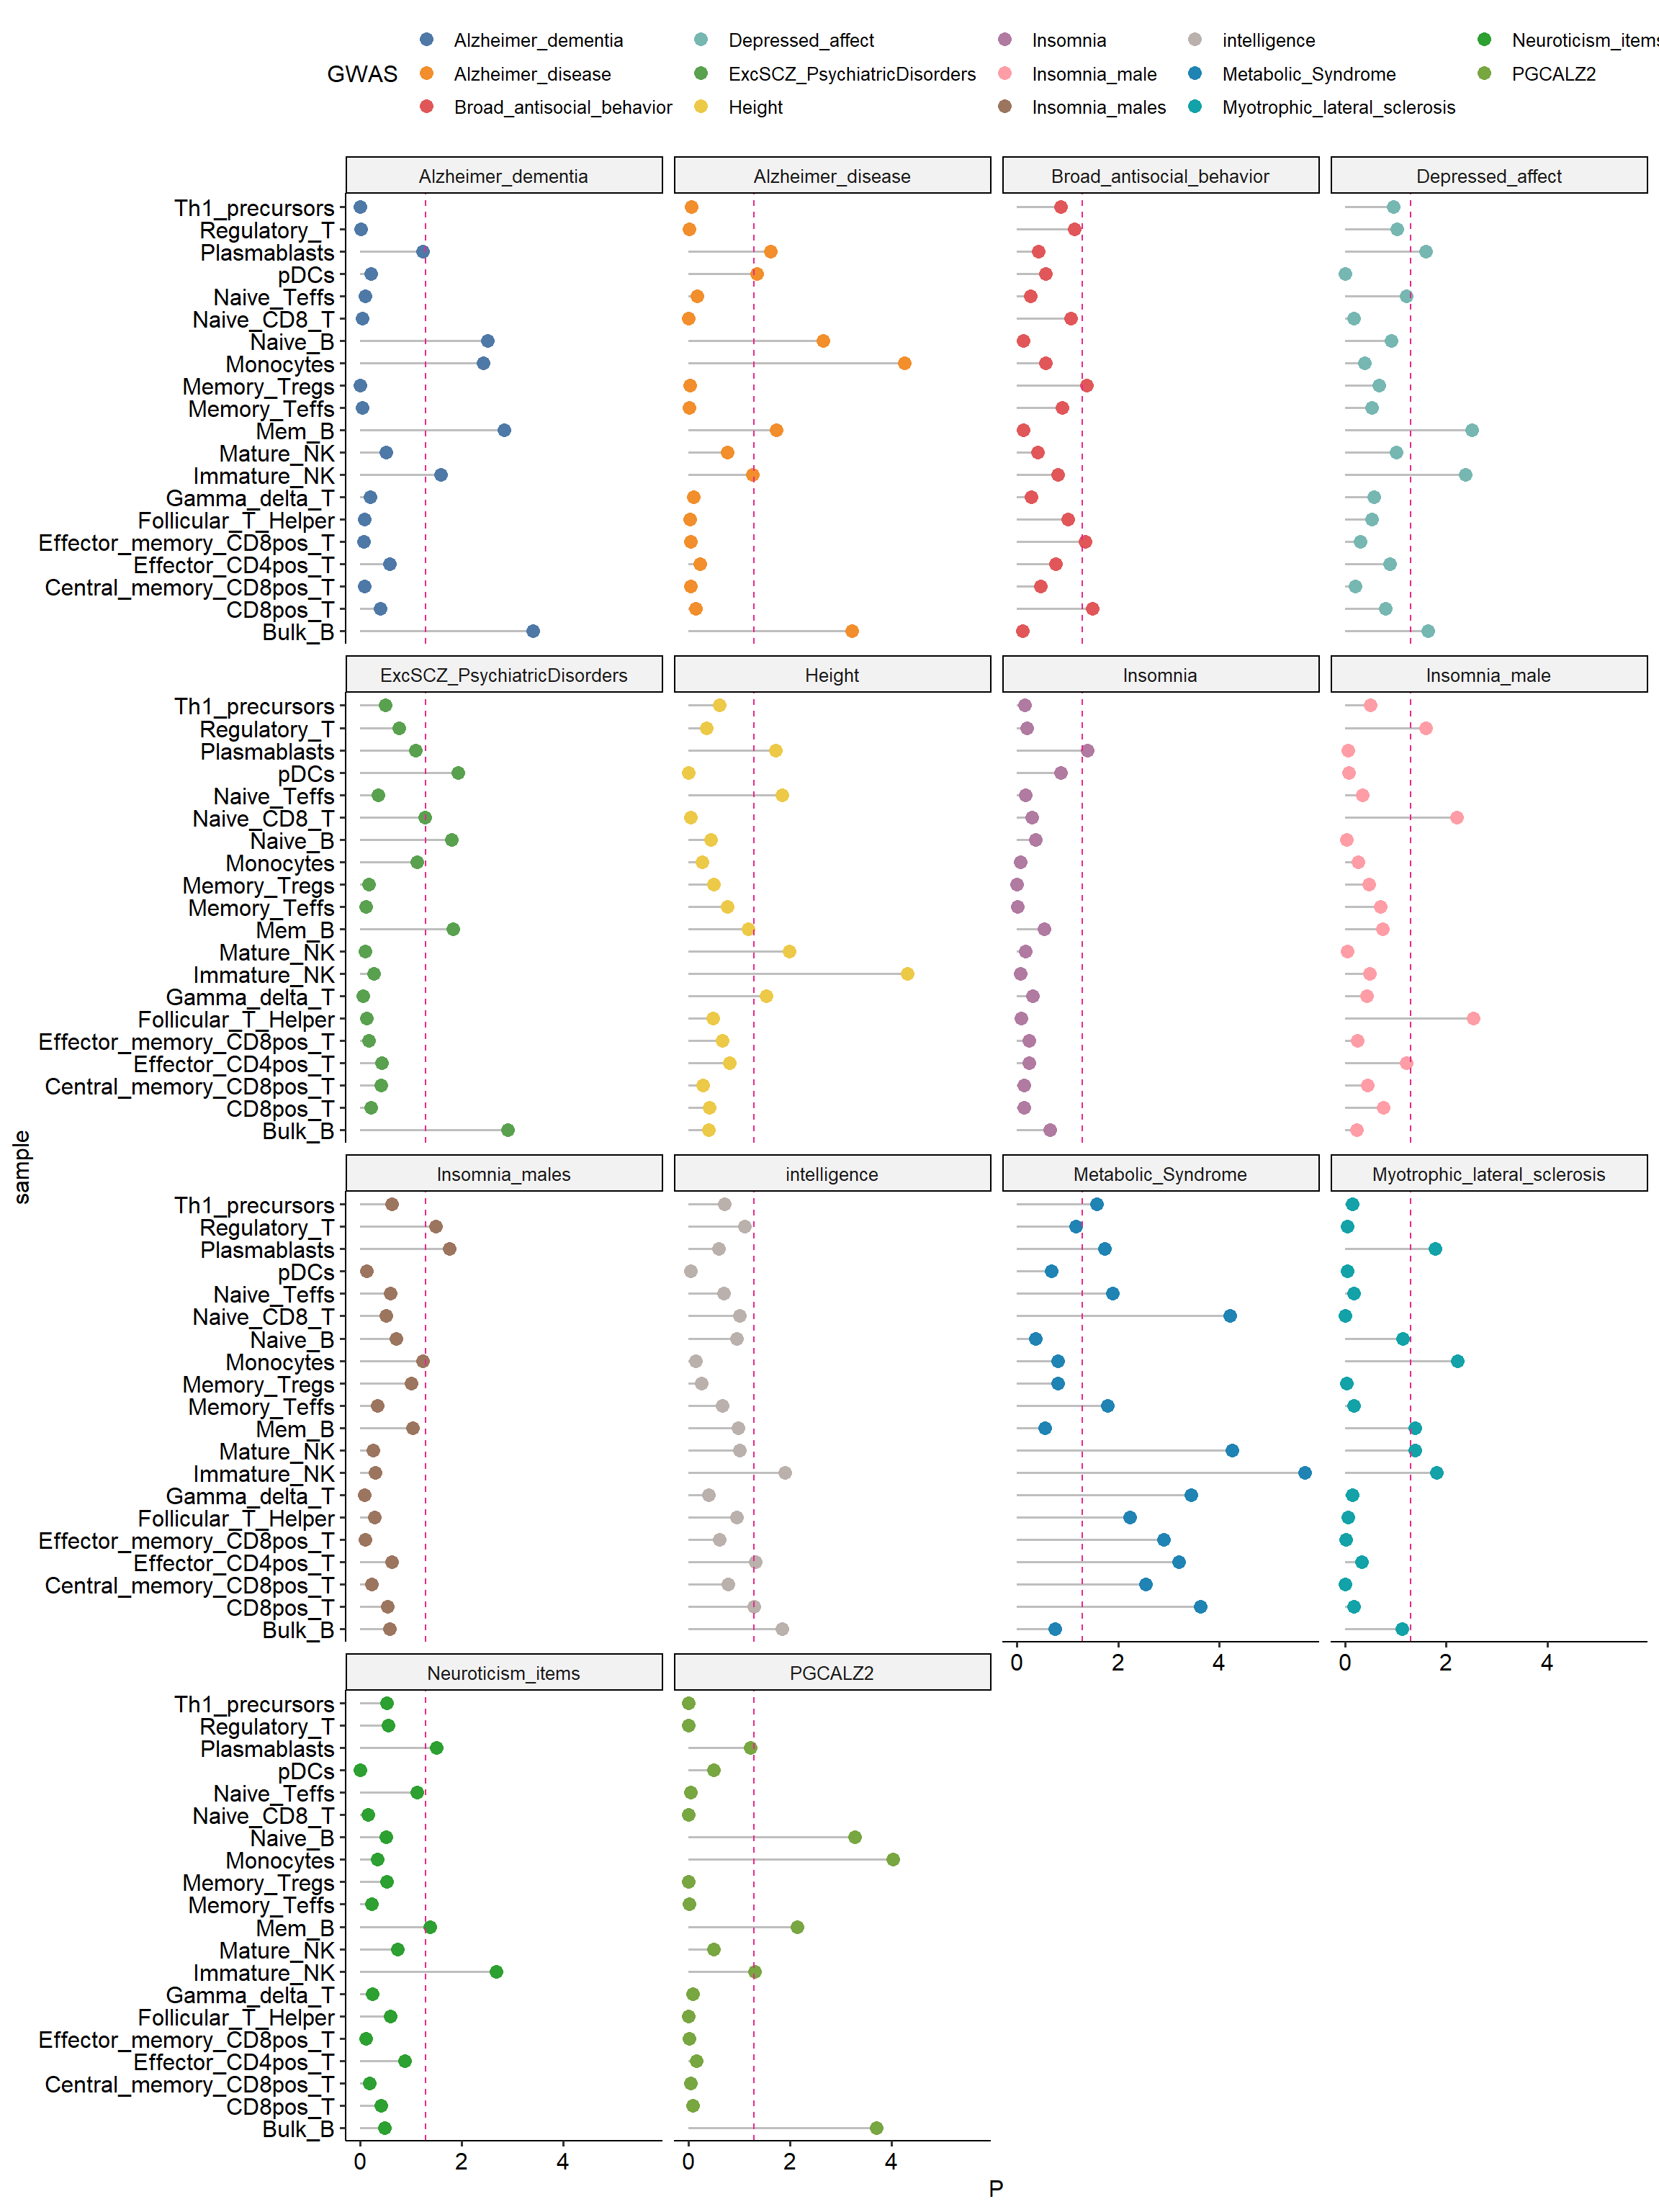
Derive P-Value: The final step is to calculate a p-value that represents the probability that the SNP-peak overlap is random in a specific cell type. The p-value is a measure of statistical significance and indicates whether the observed overlap between SNPs and peaks in a particular cell type is likely to be due to chance or if it is a meaningful association.
15.2 Preprocessing
We downloaded some of the GWAS association results from the CNCR database to demonstrate this part of the process.
We can first use the getCountSplit function to count the number of counts for each sample.
getCountSplit(sample_list=c("Bulk_B",
                              "Mem_B",
                              "Naive_B",
                              "Plasmablasts",
                              "CD8pos_T",
                              "Central_memory_CD8pos_T",
                              "Effector_memory_CD8pos_T",
                              "Naive_CD8_T",
                              "Gamma_delta_T",
                              "Effector_CD4pos_T",
                              "Follicular_T_Helper",
                              "Memory_Teffs",
                              "Memory_Tregs",
                              "Naive_Teffs",
                              "Regulatory_T",
                              "Th1_precursors",
                              "Immature_NK",
                              "Mature_NK",
                              "Monocytes",
                              "pDCs"),
                            peak_path="F:/cisDynet/example/peaks",
                            cut_path="F:/cisDynet/example/cut_sites/",
                            save_file_path="F:/cisDynet/example/gwas_count/")
The GWASNorm function was next used to integrate and normalize the counts data before calculating the specificity scores.
GWASNorm(indir = "F:/cisDynet/example/gwas_count/",
         outdir = "F:/cisDynet/example/gwas_count/",
         prefix = "All_disease")
## 2023-10-23 19:17:17 Reading counts data...## 2023-10-23 19:17:27 Normalizing...15.3 Do Enrichment
Here we can use a loop to calculate each GWAS separately by GWASEnrichment.
for (i in Sys.glob("F:/cisDynet/example/GWAS/out/new/*.snp")){
    GWASEnrichment(euclideanNorm_file = "F:/cisDynet/example/gwas_count/All_disease_counts_normToMax_quantileNorm_euclideanNorm.txt",
                   snp = i,trait = gsub(".snp","",basename(i)),
                   output_path = "F:/cisDynet/example/gwas_enrich")
    }