Chapter 6 Peak annotaion
Peak annotation in ATAC-seq data analysis was performed to further understand DNA sequences and functions within open chromatin regions. Annotating peak can help to categorize them into different functional categories such as promoters, enhancers, transcription termination sites, etc. This helps to understand the distribution and function of different types of open regions in ATAC-seq data.
6.1 ChIPSeeker annotation
Now there are already tools to help us to annotate peaks, such as the popular ChIPseeker, Homer, ChIPpeakAnno and so on.
Here we run the annoPeaks function to call the annotatePeak function in ChIPseeker to annotate peaks.
annoPeaks(peak_path = "F:/cisDynet/example/peaks/",
          sample = c("Bulk_B",
                "Mem_B",
                "Naive_B",
                "Plasmablasts",
                "CD8pos_T",
                "Central_memory_CD8pos_T",
                "Effector_memory_CD8pos_T",
                "Naive_CD8_T",
                "Gamma_delta_T",
                "Effector_CD4pos_T",
                "Follicular_T_Helper",
                "Memory_Teffs",
                "Memory_Tregs",
                "Naive_Teffs",
                "Regulatory_T",
                "Th1_precursors",
                "Immature_NK",
                "Mature_NK",
                "Monocytes",
                "pDCs"),
          peak_suffix = "_peaks_unique.narrowPeak.bed",
          annoDb_name = "org.Hs.eg.db", plot_percent=F)
## Import genomic features from the file as a GRanges object ... OK
## Prepare the 'metadata' data frame ... OK
## Make the TxDb object ... OK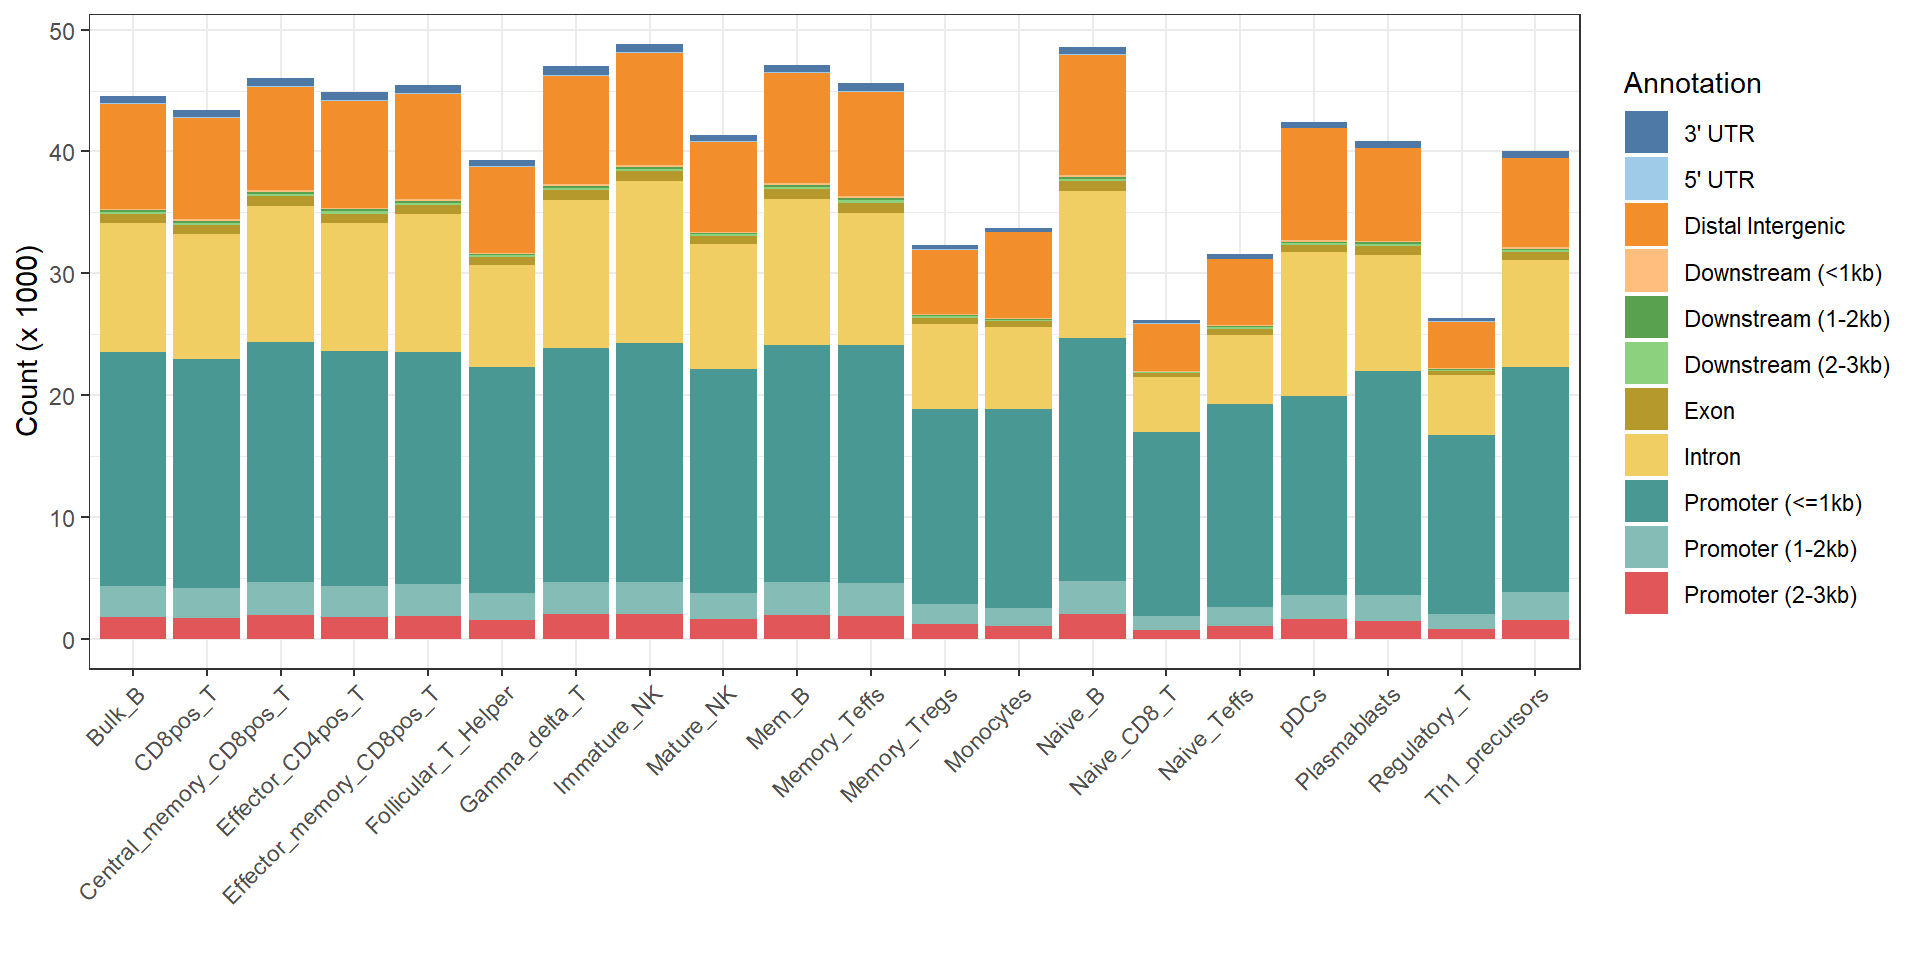
6.2 The distance of Peak summit to TSS
Another annotation of peaking can be performed by using the distribution of distances from peaking summits to the nearest TSS to delineate the proximal and distal regulatory regions. We can use plotSummitDis to see its exact distribution. We can see that at about 3kb we can divide the distribution into two groups, which we will refer to as proximal and distal regulatory regions.
plotSummitDis(peak_path = "F:/cisDynet/example/peaks/",
              sample = c("Bulk_B",
                "Mem_B",
                "Naive_B",
                "Plasmablasts",
                "CD8pos_T",
                "Central_memory_CD8pos_T",
                "Effector_memory_CD8pos_T",
                "Naive_CD8_T",
                "Gamma_delta_T",
                "Effector_CD4pos_T",
                "Follicular_T_Helper",
                "Memory_Teffs",
                "Memory_Tregs",
                "Naive_Teffs",
                "Regulatory_T",
                "Th1_precursors",
                "Immature_NK",
                "Mature_NK",
                "Monocytes",
                "pDCs"),
              suffix = "_peaks_unique.narrowPeak.bed")
## Scale for x is already present.
## Adding another scale for x, which will replace the existing scale.
## Picking joint bandwidth of 0.115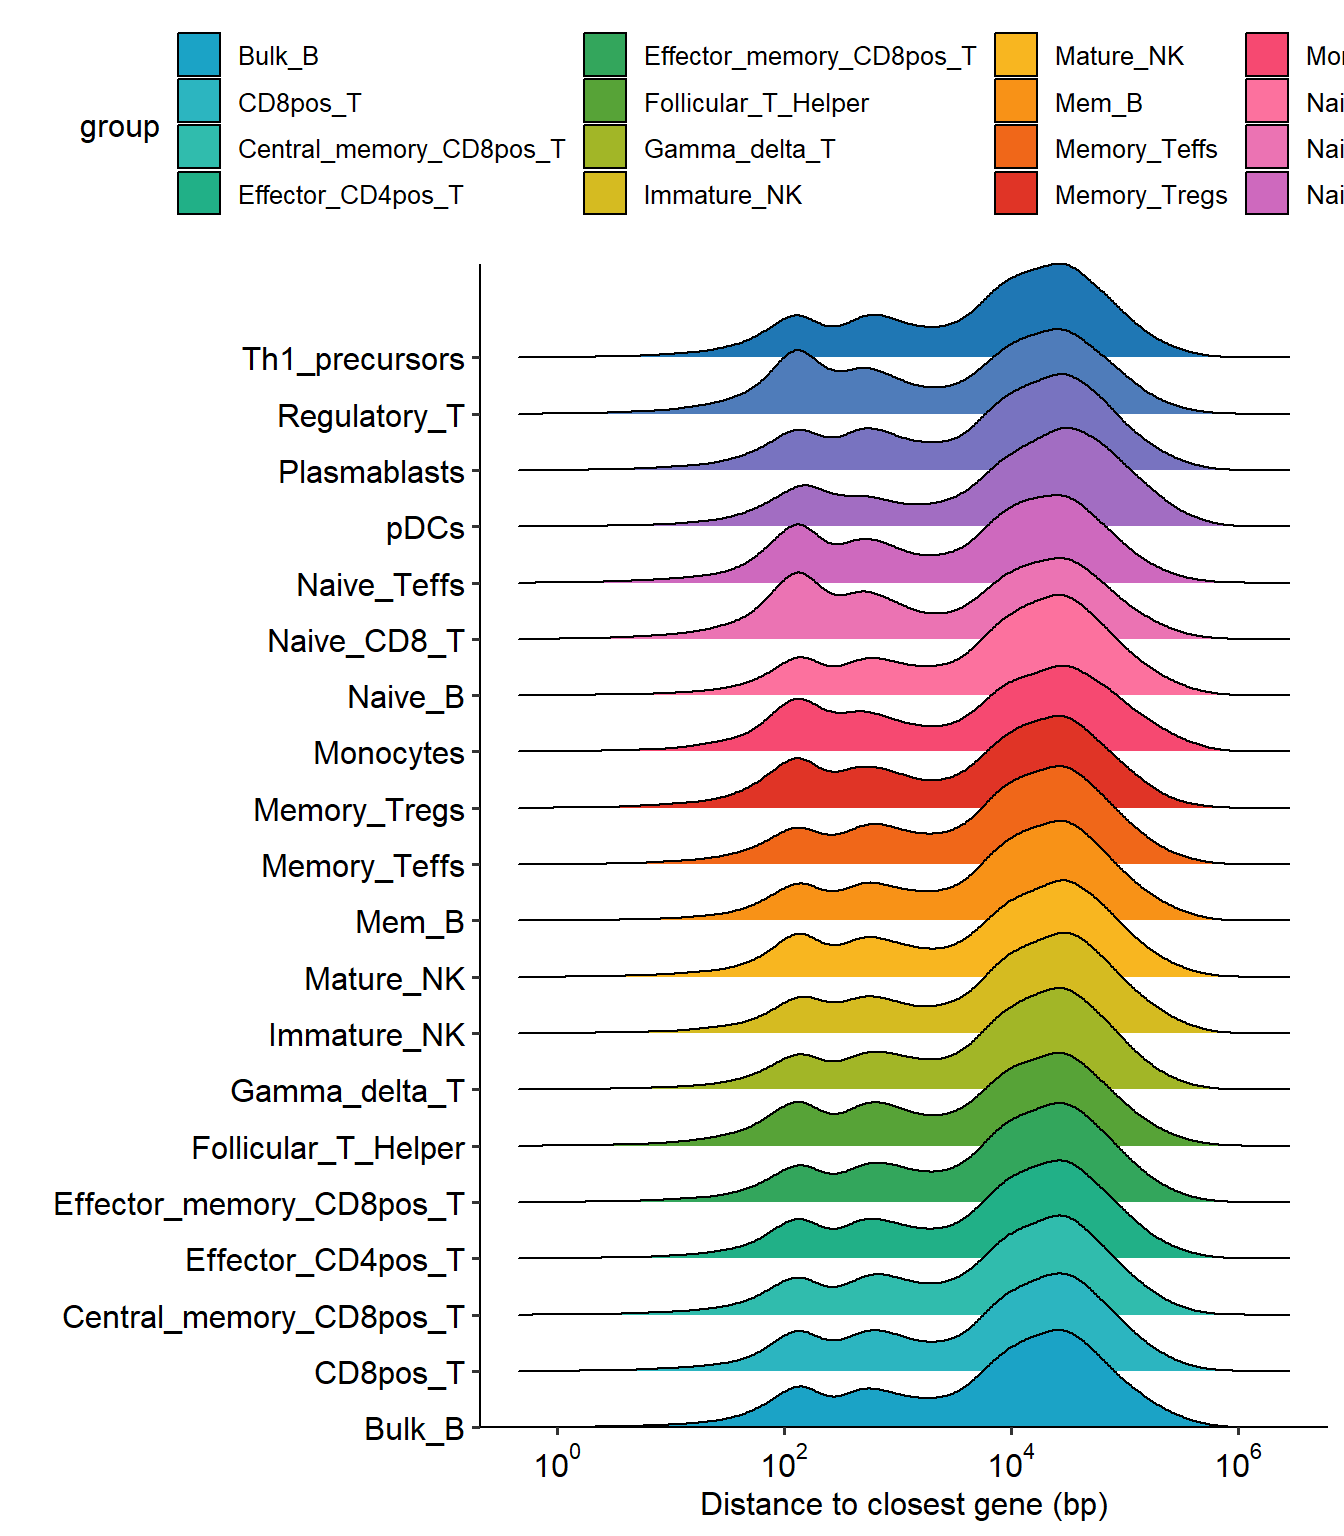
6.3 Proximal / Distal / Intragenic Annotaion
So based on the above thresholds for dividing proximal and distal regulatory regions, we can divide them into proximal, distal, and intragenic annotations.
plotPDI(peak_path = "F:/cisDynet/example/peaks/",
        sample = c("Bulk_B",
          "Mem_B",
          "Naive_B",
          "Plasmablasts",
          "CD8pos_T",
          "Central_memory_CD8pos_T",
          "Effector_memory_CD8pos_T",
          "Naive_CD8_T",
          "Gamma_delta_T",
          "Effector_CD4pos_T",
          "Follicular_T_Helper",
          "Memory_Teffs",
          "Memory_Tregs",
          "Naive_Teffs",
          "Regulatory_T",
          "Th1_precursors",
          "Immature_NK",
          "Mature_NK",
          "Monocytes",
          "pDCs"),
        suffix= "_peaks_unique.narrowPeak.bed",
        cutoff=3000, tss_flank=1000)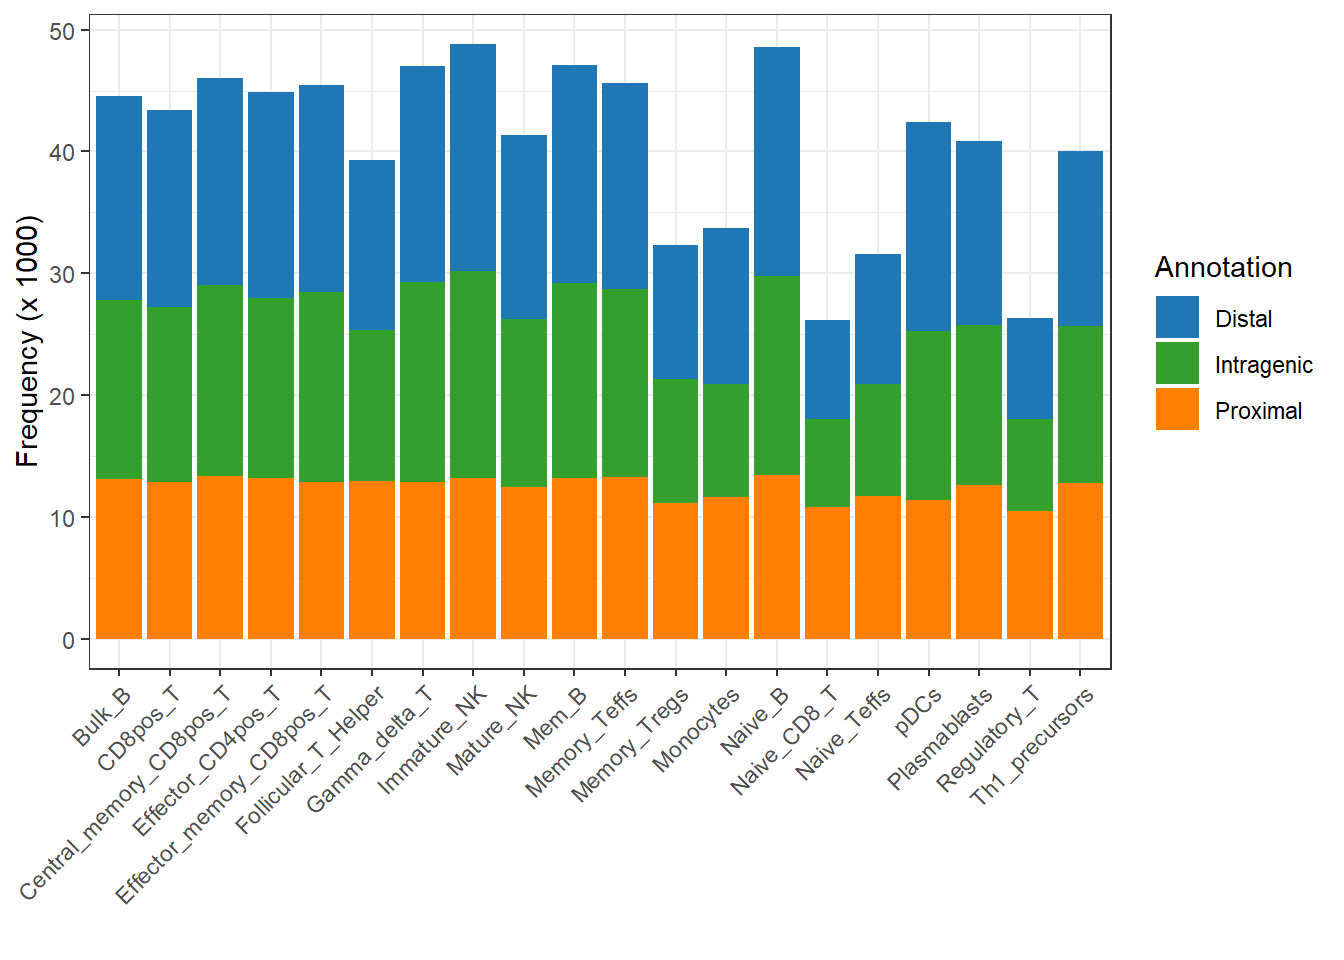
6.4 Annotation for merged peaks
Above is the annotation for each peak dataset, we can also merge these peaks sets before annotating them. The results of the annotations here will be used later in the peak-to-gene chapter.
anno <- annoMergedPeaks(quant_data = "F:/cisDynet/example/ATAC_CPM_Norm_Data.tsv",
                        cutoff=3000,
                        tss_flank=1000,
                        save_path = "F:/cisDynet/example/", save_name = "Merged_Peak_Anno")
## x
## 1 F:/cisDynet/example//Merged_Peak_Anno_Merged_Peaks_Annotations.tsvhead(anno)## Chromosome Start End Type summit
## chrY:9929934-9930084 chrY 9929934 9930084 Distal 9930009
## chrY:9943874-9944168 chrY 9943874 9944168 Distal 9944021
## chrY:9944420-9944923 chrY 9944420 9944923 Distal 9944671
## chrY:9954703-9954903 chrY 9954703 9954903 Distal 9954803
## chrY:9984566-9984742 chrY 9984566 9984742 Distal 9984654
## chrY:9984877-9985027 chrY 9984877 9985027 Distal 9984952